Last modified:
Previously, the chart was called: Temperature/energy chart.
Chart
View the chart at System level in the Evaluation tab in the Section: System analysis.
Basic info
|
Description |
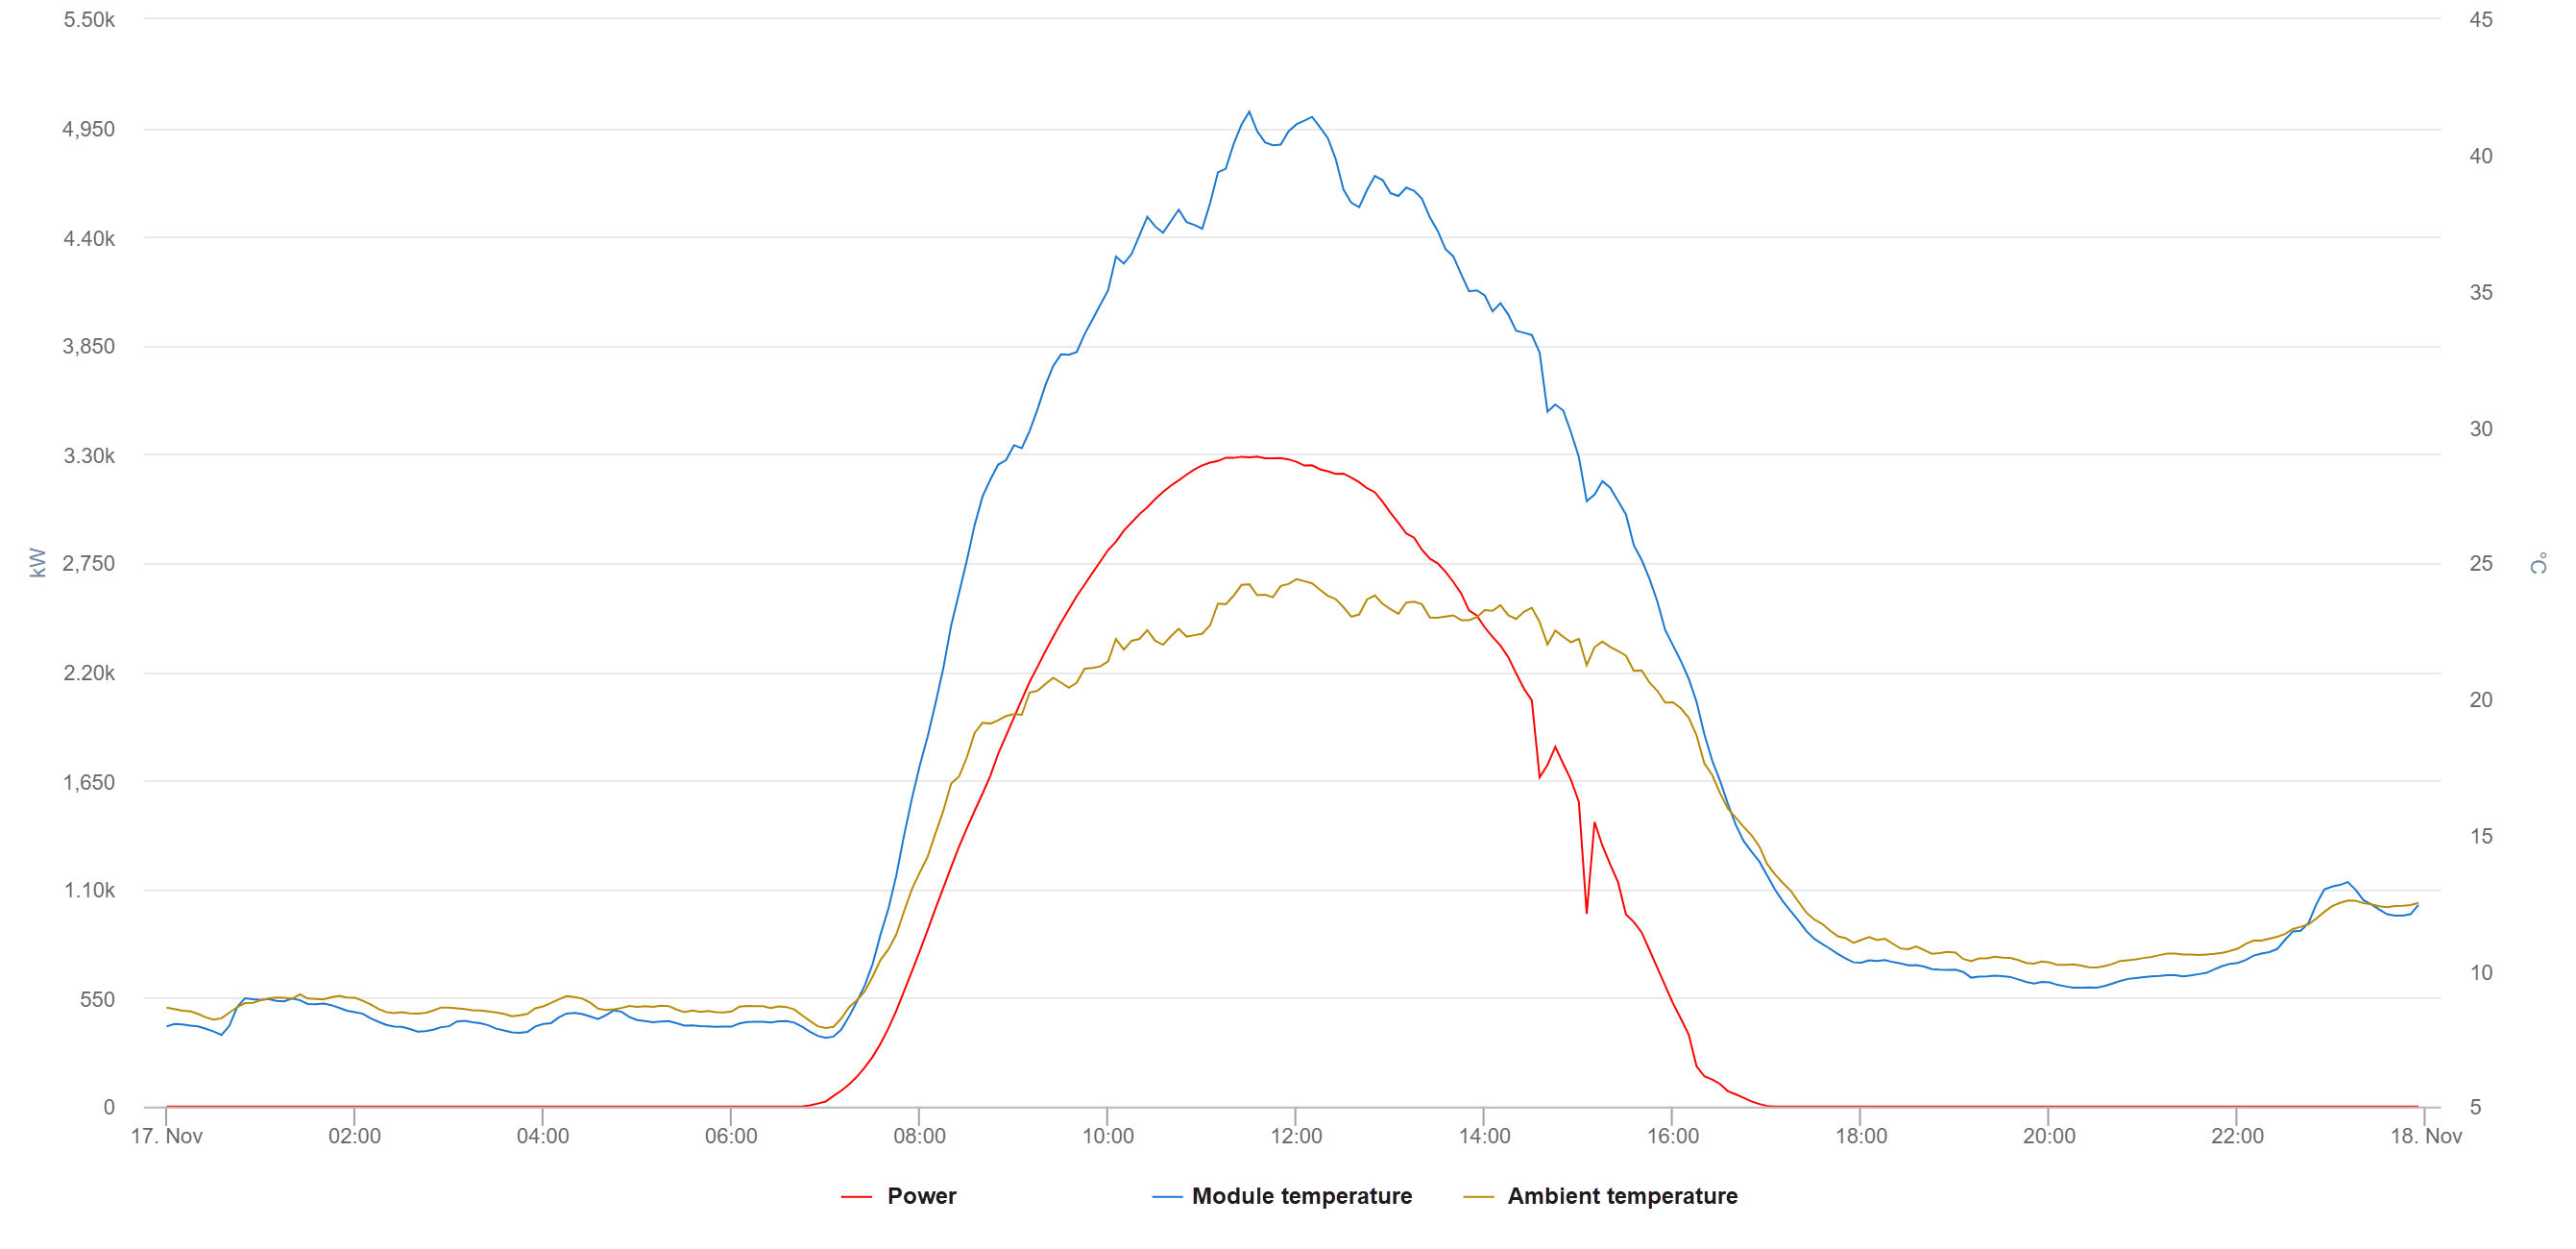
The chart displays different temperatures in comparison to the generated power/energy for the selected period (day/week/month/year). |
|---|---|
|
Prerequisites |
|
|
Further details |
|
Notes
-
Find further information on the general functions within charts on Evaluations & charts.
-
If you require further assistance in configuring the chart, contact Support.