.svg)
Last modified:
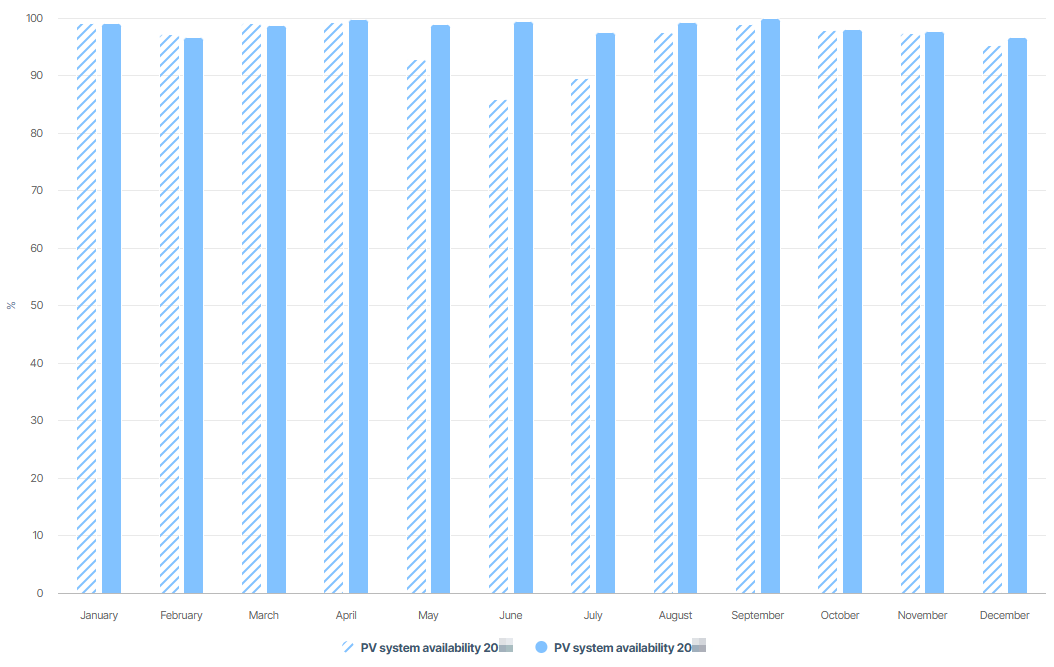
Previously, the chart was called: System availability.
Chart
View the chart at System level in the Evaluation tab in the Section: System KPIs.
Basic info
|
Description |
System availability is the percentage of a system that is available over a period of time. It is an indicator of how quickly faults are identified and remedied. |
|---|---|
|
Prerequisites |
|
|
Further details |
Calculation
Editable calculation parameters
Standard formula The following availability formula is used by default: 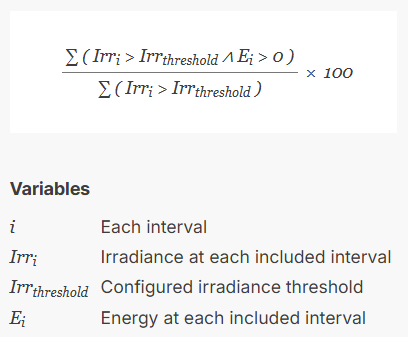
|
Note
Find further information on the general functions within charts under Evaluations & charts.
Sample calculation
The following sample calculation is based on the standard availability formula:
|
Interval |
POA irradiance (W/m2) |
Energy (kWh) |
Result |
|---|---|---|---|
|
I1 |
90 |
10 |
Not rated |
|
I2 |
125 |
20 |
100% |
|
I3 |
200 |
30 |
100% |
|
I4 |
80 |
0 |
Not rated |
|
I5 |
250 |
0 |
0% |
|
I6 |
200 |
NULL* |
100% |
|
I7 |
150 |
30 |
100% |
|
I8 |
130 |
20 |
100% |
|
I9 |
110 |
0 |
0% |
|
System availability |
5/(5+2) = 71.4% |
||
|
*NULL means no data available for this interval. |
|||