.svg)
Last modified:
Chart
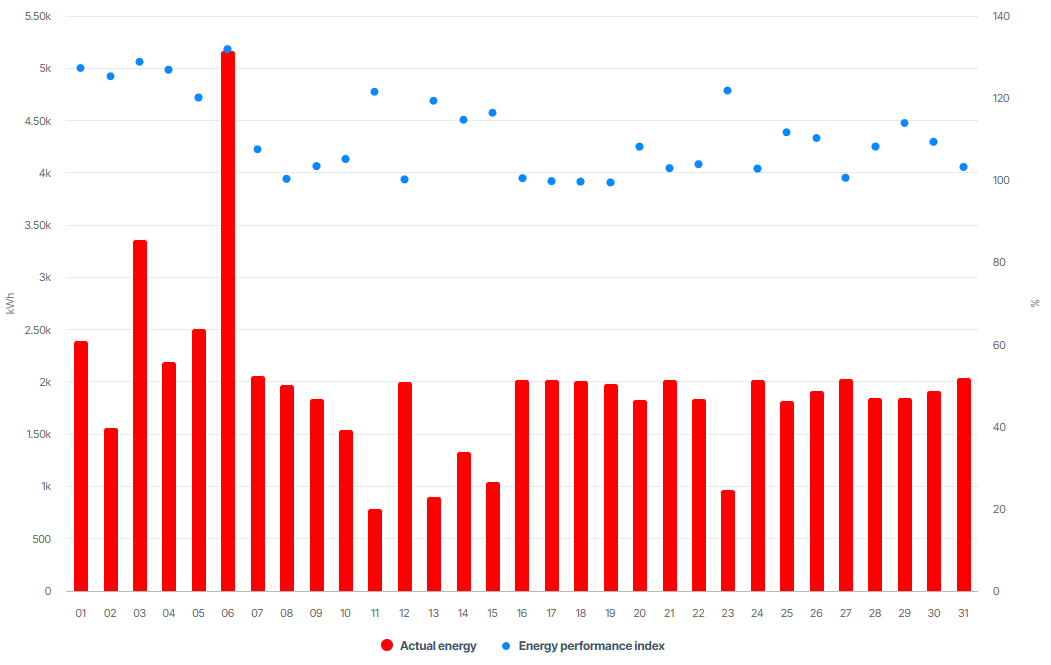
View the chart at System level in the Evaluation tab in the Section: System KPIs.
Basic info
|
Description |
The EPI/Energy performance index is the ratio between a system’s actual normalized AC energy and the expected normalized AC energy. Ideally, the value should be as close to 100% as possible. Expected normalized energy is calculated based on the selected simulation method. |
|---|---|
|
Prerequisites |
|
|
Further details |
None |
Note
Find further information on the general functions within charts under Evaluations & charts.