Last modified:
The simulation in VCOM provides a real-time target value of expected power/energy for each of your PV systems. Both the sensor-based and satellite-based simulations are based on the interval defined for your system (e.g. 5/10/15 min).
The simulation affects the following areas of VCOM:
-
Expected AC energy range (simulation) chart in the
-
Control visualization chart
-
Total outage alarms and Misproduction alarms: Separate configuration required. See Calculation methods for total outage and misproduction alarms.
Simulation parameters
Target range
The Target range is an acceptable deviation from the simulated expected power/energy. It is a percentage that is applied to the simulation's target value and it is interpreted as +/-, that is plus and minus target range relative to the base value.
Example
-
The simulated target value for expected power/energy is 100%.
-
You enter an acceptable deviation for the Target range: 10%
-
This results in a target range of 90-110% for the expected power/energy.
Data outside of this range is considered a yield loss.
Simulation methods
The following methods are used to estimate theoretical production. The method you choose depends on your system setup and preferences.
Target performance ratio (PR)
This is the default method and is a basic simulation based on the Target performance ratio.
Expand for further details about target PR
-
If using sensor data, a G_M0 term must be defined. See Terms. Otherwise, satellite data is used.
-
You have manually configured the target PR range at System level >


Formula
The following formula is used for the target performance ratio.
Energy (simulated) [kWh] = Nominal Power[kW] x Irradiance [kWh/m²] x Target PR
Example
Energy (simulated) [kWh] = Nominal Power[kW] x Irradiance [kWh/m²] x Target PR
17111.43 = 10910.9 x 1.96036 x 80%
Physical simulation
The physical simulation uses additional parameters to provide more accurate results:
-
Sensor irradiance: All irradiance sensors defined in a system are taken into account, depending on how they fit the production. This includes sensors connected to the data logger and sensors defined as a term.
-
Number of modules
-
Module power: maximum power points in the subsystem setup
-
Number of inverters
-
Inverter output power: rated output power
-
Power control correction value
Machine learning simulation (artificial intelligence optimized simulation)
Machine learning algorithms analyze the historically measured data of the PV system and optimize the physical simulation. The machine learning simulation allows you to learn site-specific characteristics such as shading, clipping, and degradation.
Expand for further details on the machine learning simulation
-
All inverters are assigned to a subsystem
-
If using sensor data: At least one working irradiance sensor. Otherwise, satellite data is used.
-
70% or more of the daytime data points are valid
-
At least two weeks’ worth of valid training data within the last 30 days is available
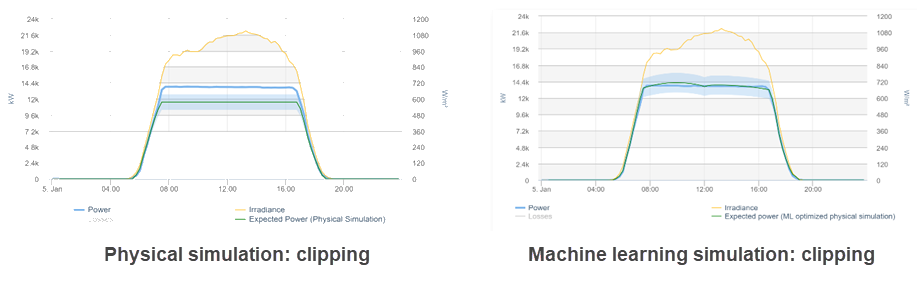
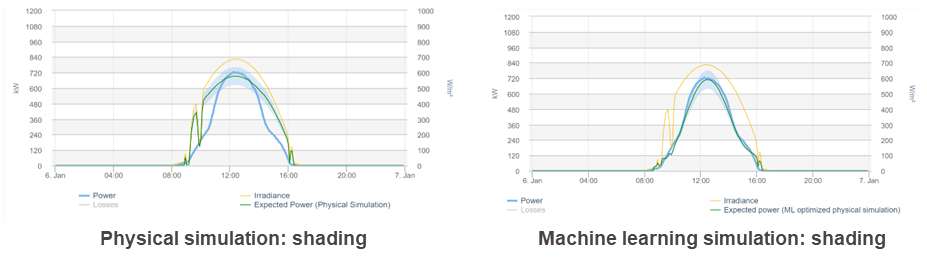
Comparison of the physical simulation and machine learning simulation
The graphics below show how the physical simulation can be improved with machine learning, using clipping and shading as examples.
Examples
Clipping
Shading
Configure the simulation
Select the simulation method you want to use to calculate the expected power in the evaluation charts.
Steps-
At System level , go to
-
Select a percentage for the Target range.
-
Select the Simulation method.
-
Select

The selected method is now applied to calculations. The expected power/energy is displayed in the charts accordingly.
We recommend selecting a simulation method and target range once and only changing it if you want to compare which options display the best results for your system. When making any changes, be sure to select ![]()
![]()
Recalculate simulation values
If you change a term, for example, an irradiance term, you may need to recalculate the simulation.
Example
If a sensor malfunctions, you will switch sensors. To ensure accuracy, this requires you to recalculate the simulation.
Note
Switching from one simulation method to another does not require recalculation.
-
At System level , go to
-
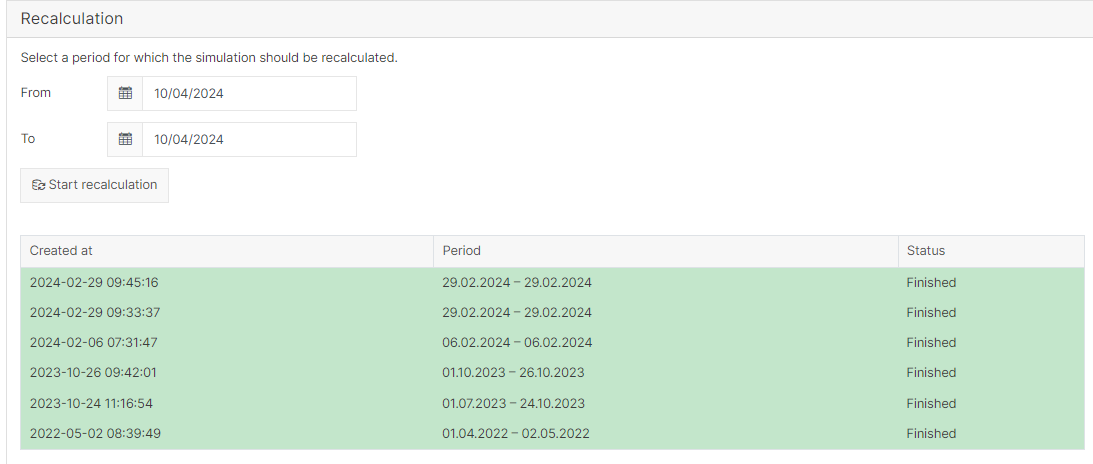
Under Recalculation, select the period you want to recalculate.
-
Select Start recalculation.
The recalculation will appear in the table below, and the recalculated values will be applied to the relevant charts.