Power control tab
Last modified:
The growth of the renewable energy market has made the integration of renewable energy sources more complex and challenging. System operators and O&M managers are facing more frequent curtailments ("power control events") by grid operators or energy traders to ensure grid stability or to respond to the daily market demands of energy trading. Since curtailments are linked to revenue loss, VCOM users need both real-time and historical overviews of what is happening at the grid connection point of their systems. They also need a quick way to calculate for compensation when the system is curtailed.
The Power control tab is an additional tab at SYSTEM LEVEL containing portlets that display power control information. It is specially set up for systems that are frequently curtailed, for example by a grid operator, energy trader, or manually by the system owner.
Prerequisites to see the power control tab
You belong to one of the following user groups: administrator, operations, or technician.
Your system has a power plant controller (PPC) and it appears at SYSTEM LEVEL under
 System configuration >
  Data sources > [Data logger setup] >
  Devices.
Power control tab
Portlets in the power control tab
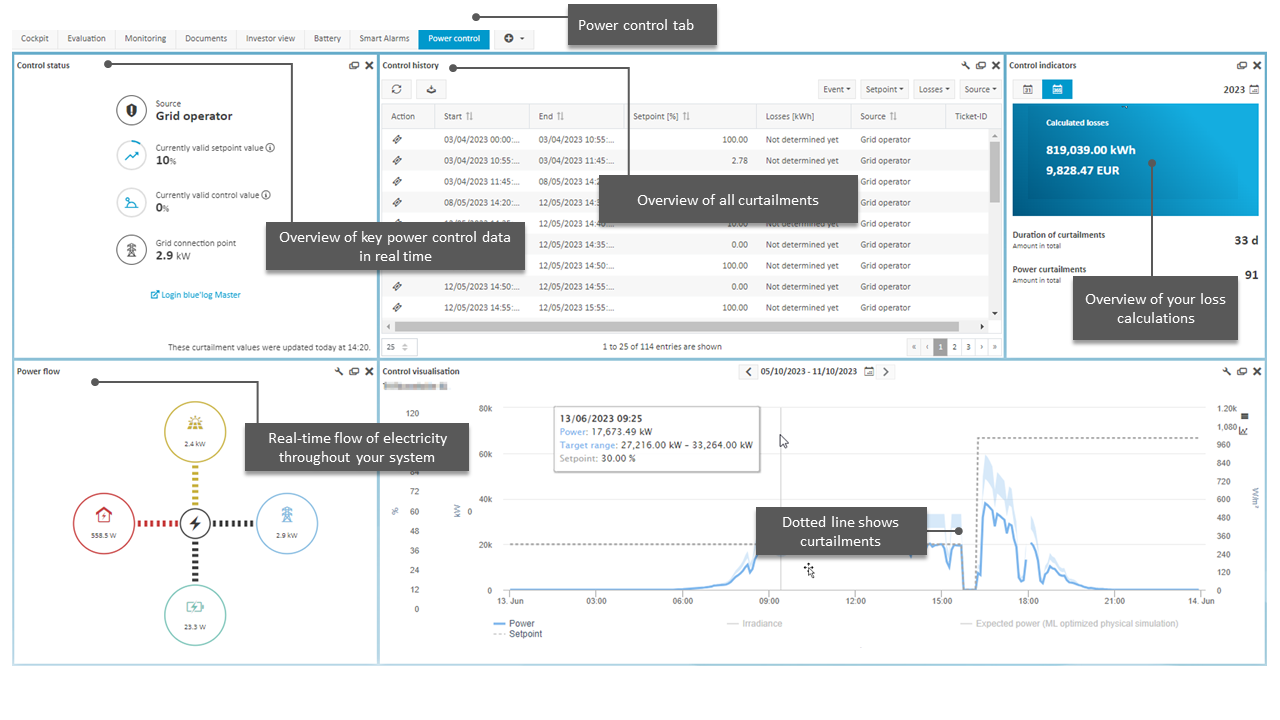
Control history portlet
The Control history portlet provides an overview of all active power curtailments of your system.
For more detailed information see Control history portlet.
Control indicators portlet
The Control indicators portlet displays information on the duration and total power of curtailments. It provides you with an at-a-glance overview of estimated losses in both kW and currency.
For more detailed information see Control indicators portlet.
Control status portlet
The Control status portlet provides an overview of key power control (curtailment) data in real time.
For more detailed information see Control status portlet.
Power flow portlet
The Power flow portlet displays the real-time power flow and direction between your system’s energy nodes, such as PV generation, grid, consumption, and batteries.
For more detailed information see Power flow portlet.
System diagram portlet
The System diagram portlet allows you to display one of your system’s charts as a portlet.
The power control tab's default system chart is the Control visualization chart.
For more detailed information see System diagram portlet.
Note
The power control portlets described above are available by default in the Power control tab. If you wish to display one of the the portlets in another tab at SYSTEM LEVEL, you can add them via the ![]() Portlet center, see Add a portlet at portfolio or system level.
Portlet center, see Add a portlet at portfolio or system level.