View the chart at System level in the Evaluation tab in the Section: System.
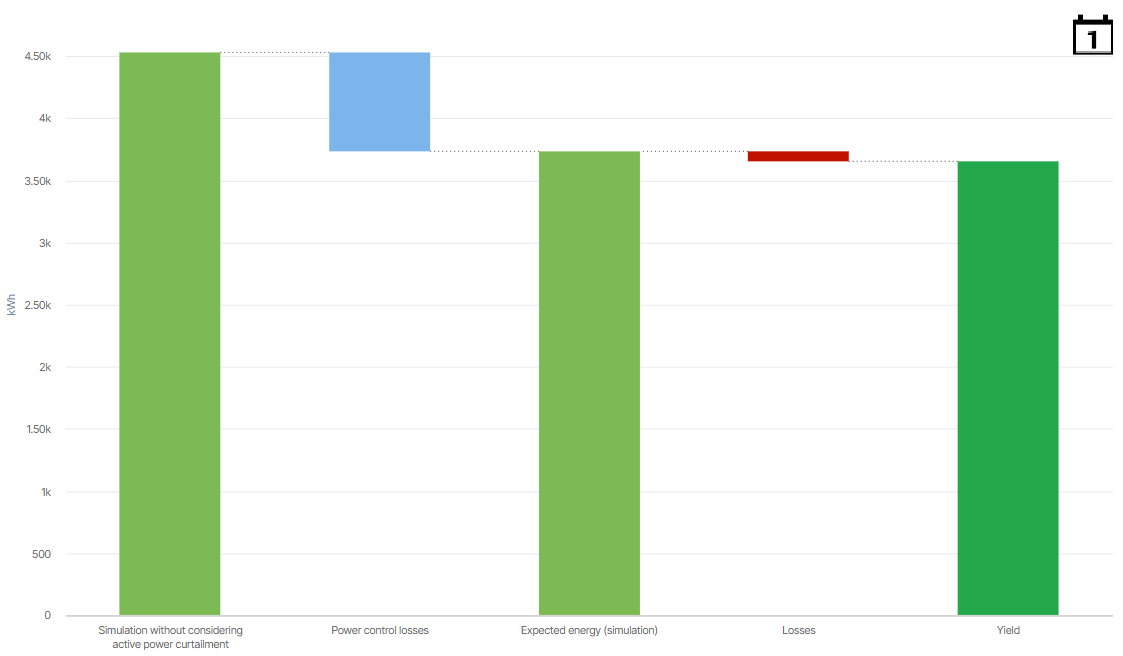
Exemplary loss breakdown chart displaying data of a system with Losses in Day view
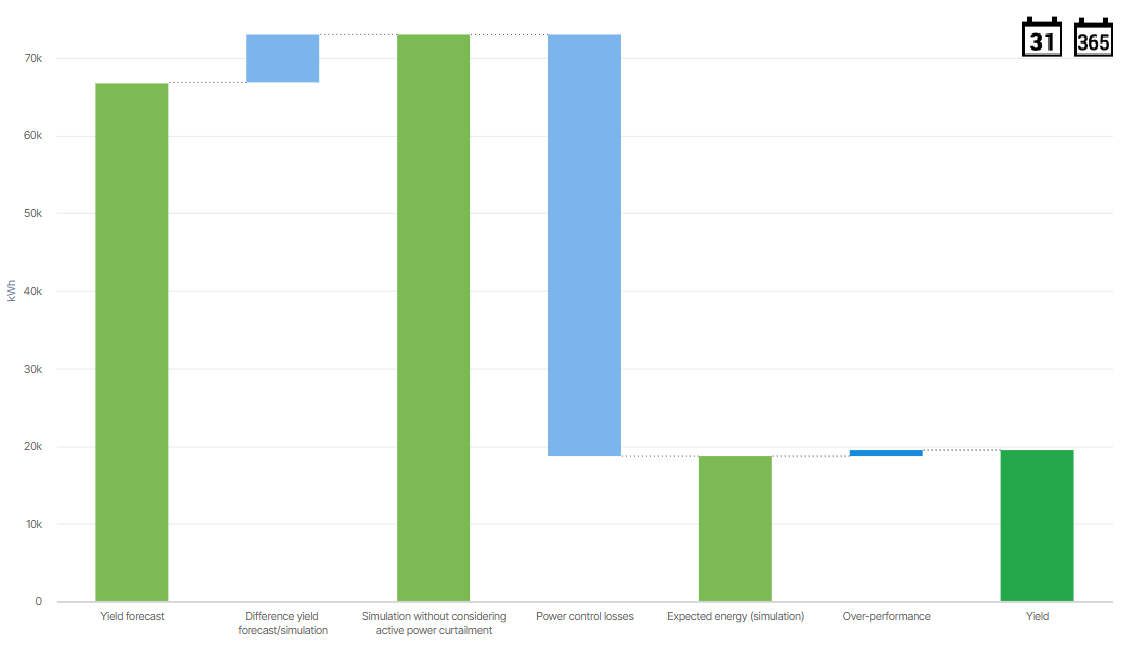
Exemplary loss breakdown chart displaying data of a system with Over-performance in Month view, therefore also including the Yield forecast and its difference value
Basic info
Description
The chart breaks down the deviations between a system’s forecasted, expected, and actual energy generation. Therefore, it displays the following values for the selected system:
Forecasted energy from the Yield forecast (only as of Month view)
and its difference to the expected energy that is simulated without considering curtailments, displayed as Difference yield forecast/simulation
both displayed only as of Month view
Expected energy that is simulated without considering curtailments, displayed as Simulation without considering active power curtailments
and its difference to the expected energy simulated with curtailments, displayed as expected Power control losses. These are not the actual power control losses, but only the ones calculated with the selected simulation method.
Expected energy simulatedconsidering active power curtailments, displayed as Expected energy (simulation)
and its difference to the actual energy generation, displayed either as
Actual Over-performance or
Actual Losses
Actual energy (= Yield)
Prerequisites
Simulation method for the expected power/energy is configured. See also Configure the simulation.
Further details
Expected power control losses are only displayed if an active power curtailment is considered in the calculation within the selected period.
Actual losses consist of:
Negative deviations outside of the target range of the expected energy with curtailments
Losses due to technical issues specified in tickets
Losses due to data/communication gaps (loss extent calculated on satellite data)
Forecasted values are only visible if a yield forecast is configured, see Configure yield forecast.
Note
Find further information on the general functions within charts under Evaluations & charts.