Last modified:
Previously, the chart was called: Self-consumption chart.
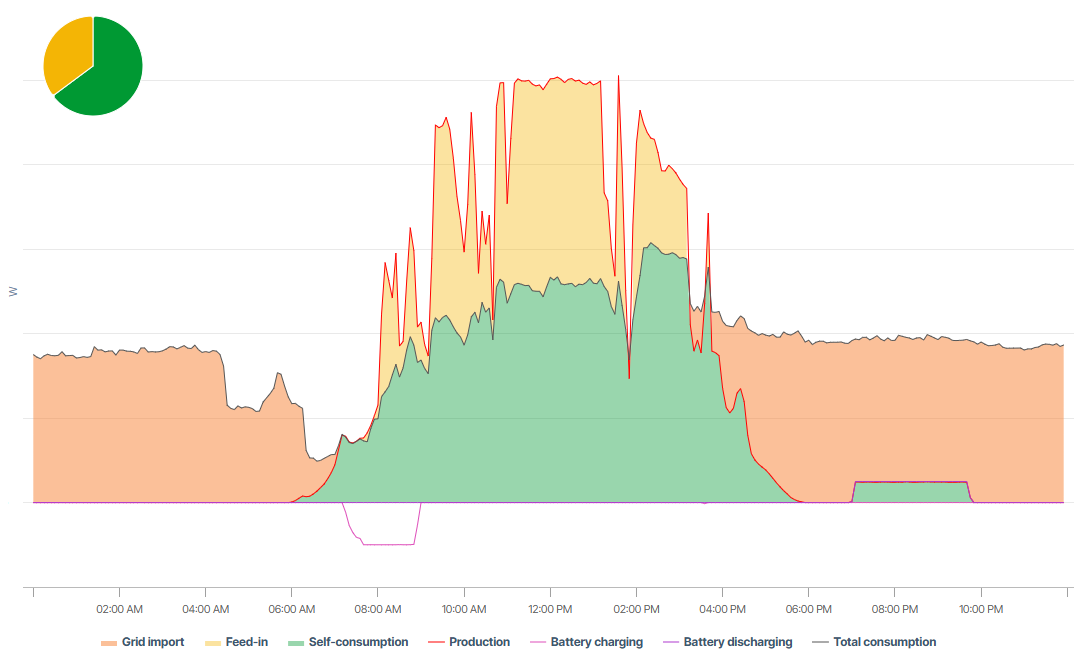
Chart
View the chart at System level in the Evaluation tab in the Section: System.
Basic info
|
Description |
The chart gives an overview of energy values over time if your system consumes self-generated energy directly on-site:
If your system also has a battery:
|
|---|---|
|
Prerequisites |
|
|
Further details |
Terms
Chart colors
|
Note
Find further information on the general functions within charts under Evaluations & charts.
Always see the current power flow values on your system’s dashboard with the Power flow portlet.
Troubleshooting
Problem: Feed-in/grid export and Grid import are reversed
Cause
The “reference arrow direction” on your data logger or meter has been incorrectly configured. This causes the power transformer to reverse the values for grid import and export, and results in an incorrect self-consumption chart.
Solution
Change the reference arrow direction.
Prerequisites-
User group technician or higher
-
At system level , go to


-
In the area Self-consumption, select

-
Tick the check box Change import/export direction.
-
Select

The values in the self-consumption chart are corrected now.
Note
Alternatively, correct the configuration on your data logger or meter, or ensure the power transformer is connected properly. blue'log only If using a blue’Log, see blue'Log XM/XC: Meters for correcting these configurations.
Note that the historical data will still be incorrect in this case.
Problem: Battery charging and battery discharging are reversed
Cause
Your battery interprets negative and positive power values differently than the portal does.
Solution
Change the battery power flow directions for your batteries.
Prerequisites-
User group technician or higher
-
At system level , go to
-
Select an option for how to interpret the power values of all your system’s batteries:
-
Default: Negative power values are interpreted as the battery being charged, and positive values as battery discharging.
-
Reverse: Negative power values are interpreted as the battery being discharged, and positive values as battery charging.
-
Note
Even if you use user-defined terms for battery charging and discharging, you can change the charging direction in the menu. The basic structure of your term formulas remains the same.
-
Select
The values in the self-consumption chart are corrected now.