Last modified:
Basic info
|
Item in the Portlet center |

|
|---|---|
|
Description |
If your system has many digital signals, for example in utility-scale projects, you can display these in the Digital signals portlet for a quick overview. The portlet displays all the digital signals you have imported via |
|
Prerequisites |
|
|
Portlet properties |
System portlet: The portlet can be added at the SYSTEM LEVEL . Dynamic portlet: The portlet is updated when you select a different system name from the systems list. |
|
Further details |
None |
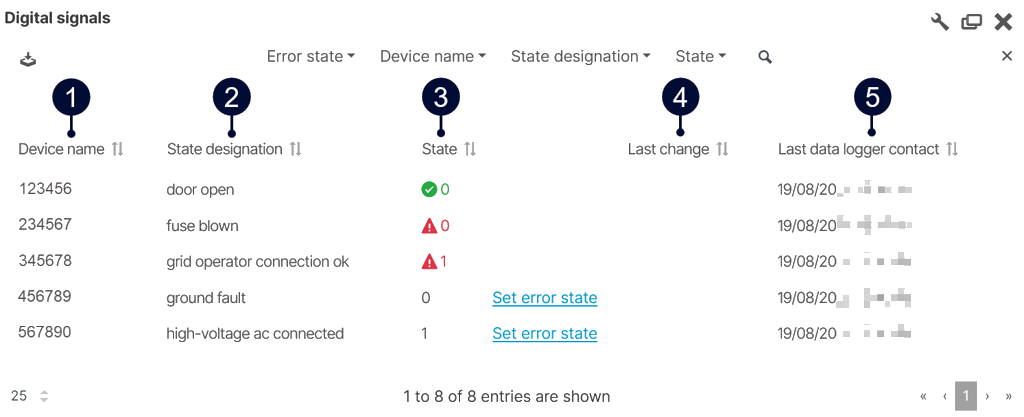
Overview of the portlet
|
Name |
Description |
|
|---|---|---|
|
1 |
Device name |
Display device name. |
|
2 |
State designation |
Display state designation. |
|
3 |
State |
Display state:
Display error state:
|
|
4 |
Last change |
Display last change. |
|
5 |
Last data logger contact |
Display last contact with data logger. |
Note
Find further information on the general functions of a portlet under Portlets.
Set up the Digital signals portlet
Prerequisites
-
Digital signals have been imported via your data source.
-
At the system level , add the Digital signals portlet.
The list of digital signals appears. -
In the portlet, select

-
Select Open data sources.
-
In the sidebar, navigate to Data logger overview > [Data source] > Digital signals.
-
Next to each digital signal, select

-
Define which state (0 or 1) of this input is considered an issue.
-
Select Set error state.
The error states are saved.
Note
If you have not defined the error state, it can not be interpreted with a green or red icon. In this case, only the current state of the digital signal input is displayed as the default.