Last modified:
Basic info
|
Item in the Portlet center |
|
|---|---|
|
Description |
The Alarms portlet gives you a complete overview of all the alarms, at both the portfolio and system level. You can decide which columns to display and in what order, filter alarms according to various criteria, view the details of each alarm, and create tickets based on the alarms. |
|
Prerequisites |
|
|
Portlet properties |
Portfolio portlet: The portlet can be added at the Portfolio Level .System portlet: The portlet can be added at the SYSTEM LEVEL . Dynamic portlet: The portlet is updated when you select a different system name from the systems list. |
|
Further details |
Tip We recommend giving the Alarms portlet sufficient space since it contains many functionalities, as illustrated in the overview.
|
Overview of the portlet
|
Name |
Details |
|
|---|---|---|
|
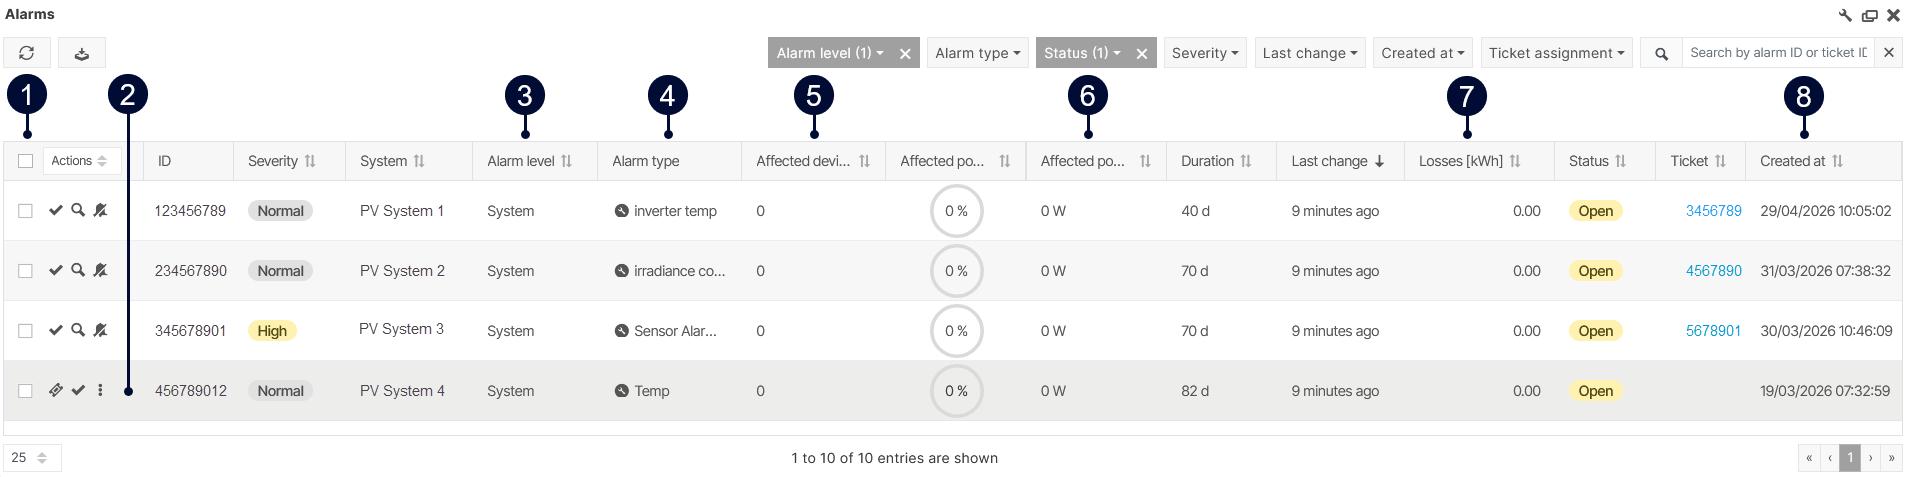
1 |
Ticket actions |
Tick multiple checkboxes to:
See also Ticket system. |
|
2 |
Further actions |
|
|
3 |
Alarm level |
Does the alarm affect the overall system or just a device?
|
|
4 |
Alarm type |
|
|
5 |
Affected devices |
Number of affected devices or designation of the affected device. |
|
6 |
Affected power |
Percentage of system power affected by the incident. You can also display the affected power in Watts via the portlet settings. |
|
7 |
Losses |
Yield loss due to the incident in kWh. See Yield loss calculation. |
|
8 |
Created at |
Date of alarm creation |
Note
Find further information on the general functions of a portlet under Portlets.
Alarm details
To view further details about an alarm, select ![]()
Affected system power
The affected system power means the percentage of overall system power affected by an incident.
Measured deviation
Actual energy (from the latest incident) vs. Expected energy (based on the calculation/simulation method you configured for misproduction alarms). Misproduction alarms only.
Chart and/or heatmap
Where relevant, a chart is displayed in a tab to visualize the alarm and help identify its root cause. Charts are not displayed for user-defined alarms.
Device events
The Device events tab shows device events of the affected component or system if the following conditions are met:
-
Device events are available. See Device events portlet.
-
The device event occurs when the alarm is open.
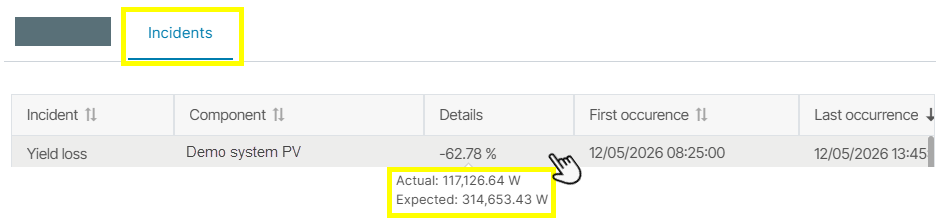
Incidents
The Incidents tab shows relevant incidents, in this case, a yield loss. Hover over the Details column to view the details of the measured deviation.
Example
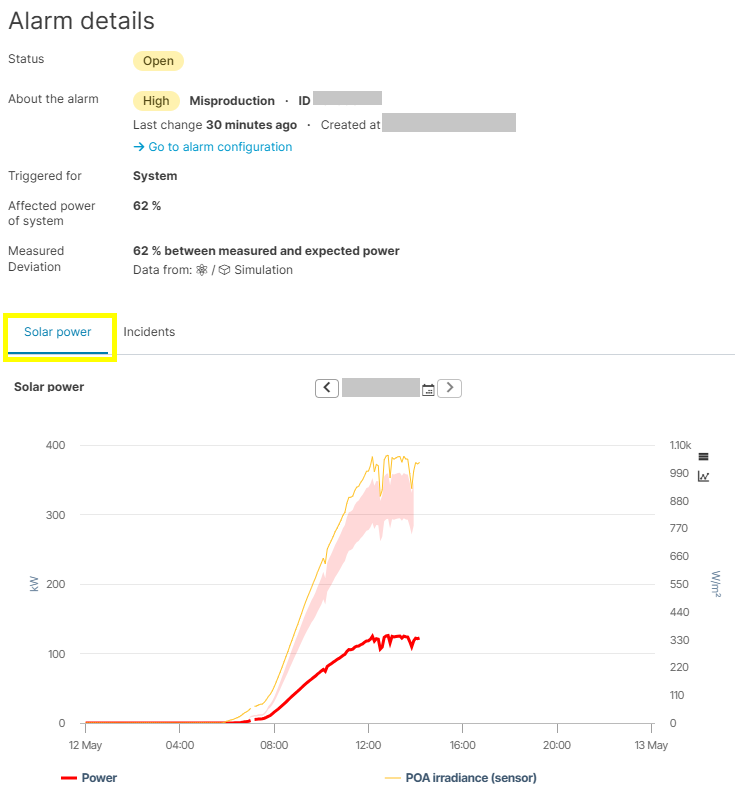
This example shows a misproduction alarm triggered at the system level.
The misproduction affects 62% of the overall system power. Based on the machine learning and physical simulations, it can be interpreted as a 62% deviation from normal behavior.
The chart displayed in the Solar power tab shows the actual power (red line) compared to the irradiance measured by a sensor (yellow line). The shaded red area shows the target range configured for the system.