Last modified:
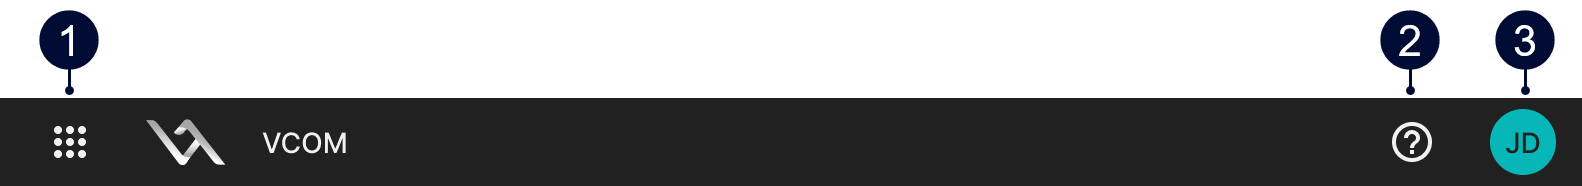
Top bar
|
Name |
Details |
|
|---|---|---|
|
1 |
|
Access mc Cloud and all your other meteocontrol applications. |
|
2 |
|
The help menu includes:
The |
|
3 |
|
In the avatar’s menu you can:
|


Operating levels
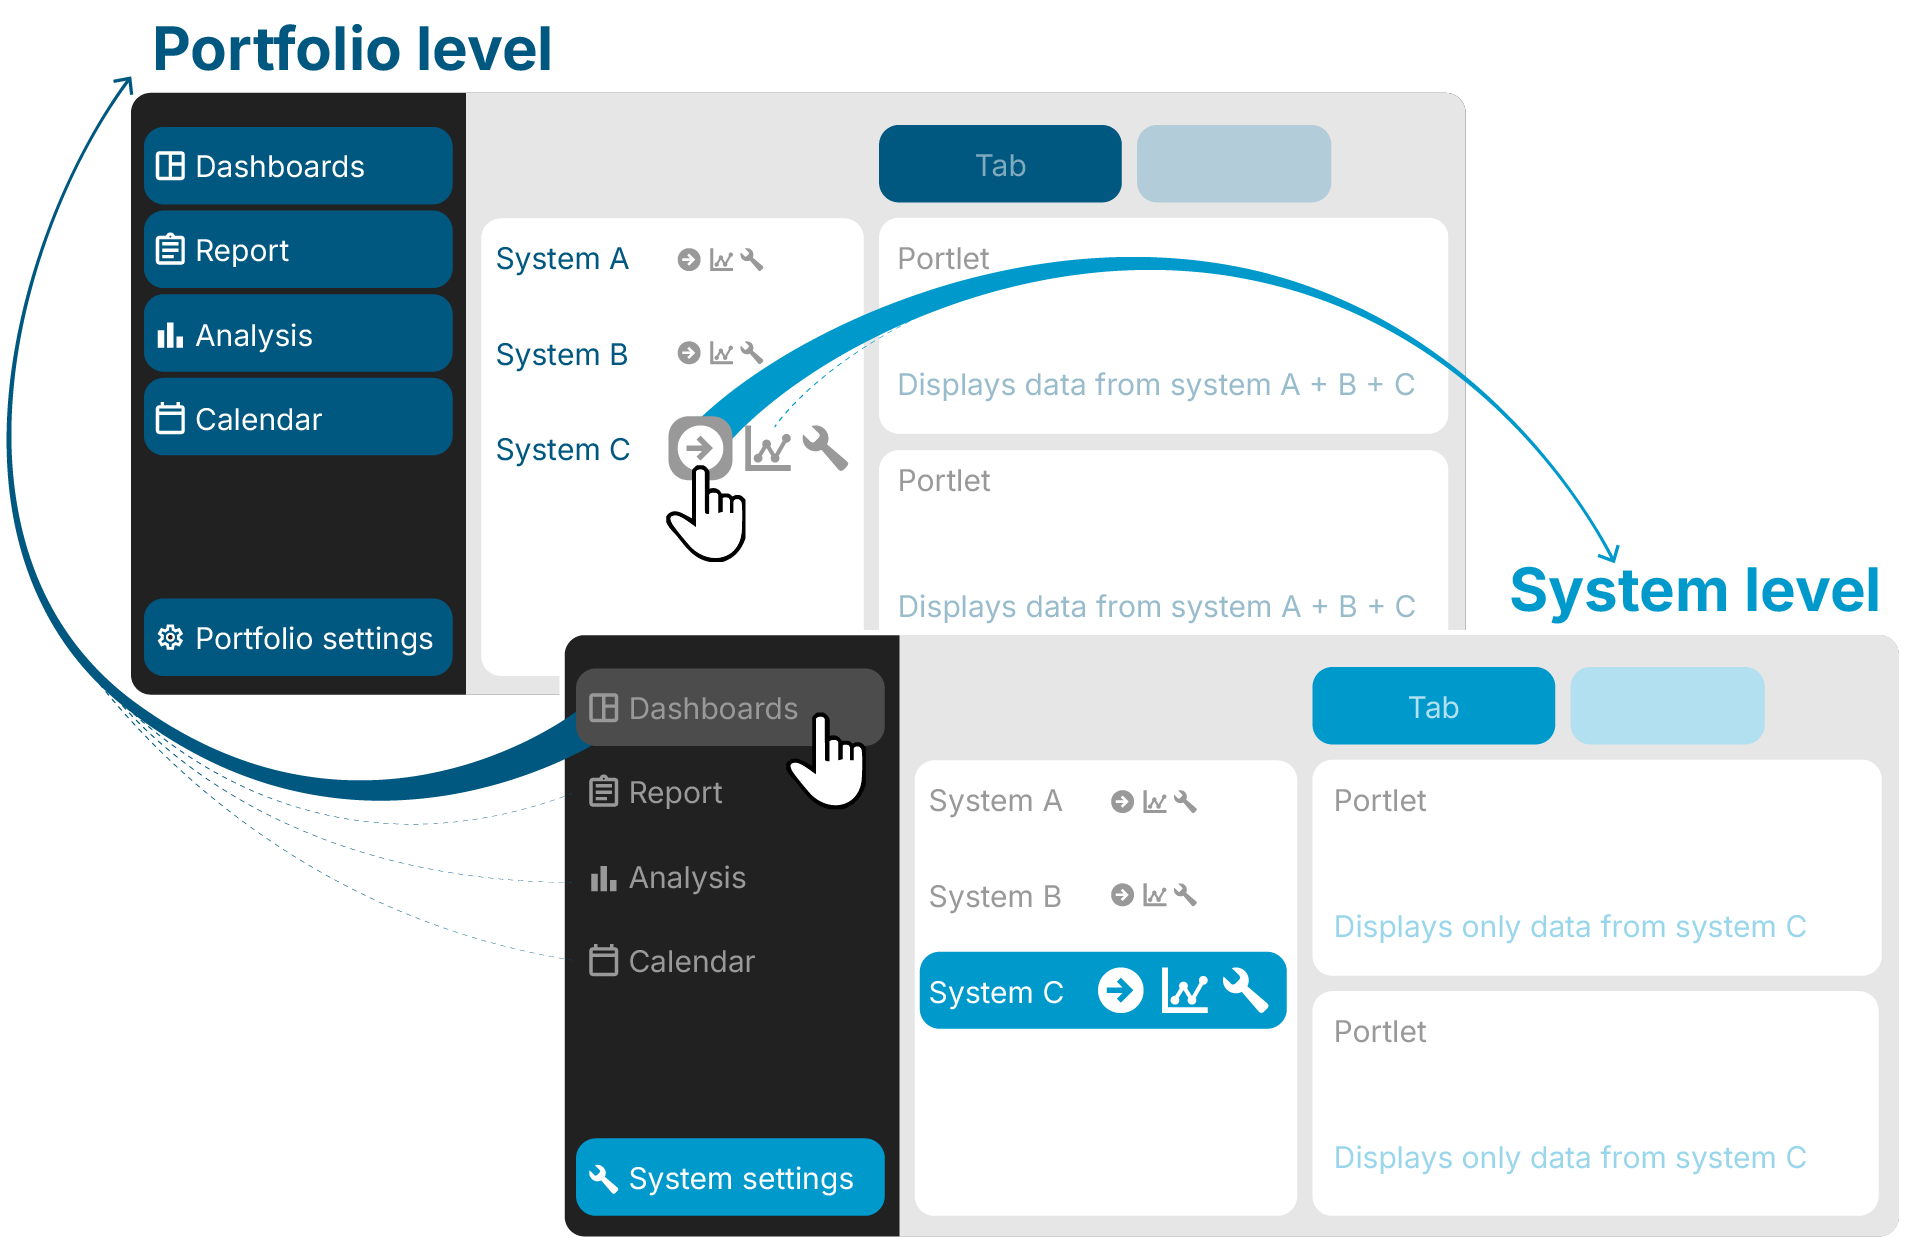
In VCOM, there are two main operating levels. Choosing one will change the view of the content area:
portfolio level : This operating level gives you an overview of all your systems in VCOM.
Adjust administrative settings that affect your entire portfolio, such as user management, at this level under 
When accessing VCOM, you usually access at portfolio level. When you later want to return from system to portfolio level, select ![]()
![]()
![]()
![]()
system level : This operating level is the individual view of each system (= plant).
Adjust settings that affect an individual system, alarms, term-definition, or feed-in revenue at this level under ![]()
To access a system level, hover over a system name in the systems list and select ![]()
![]()
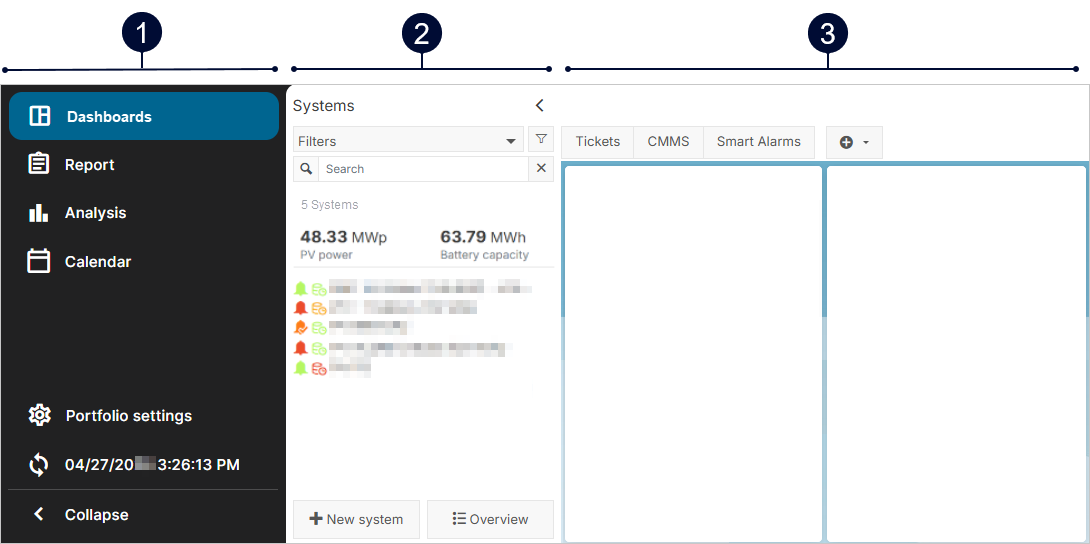
Portfolio level
|
Name |
Details |
|
|---|---|---|
|
1 |
Side bar with Portfolio-level actions and settings |
|
|
2 |
Systems list |
|
|
3 |
Content area
|
When selecting a portfolio-level action, the content in this area is adjusted accordingly. For the |

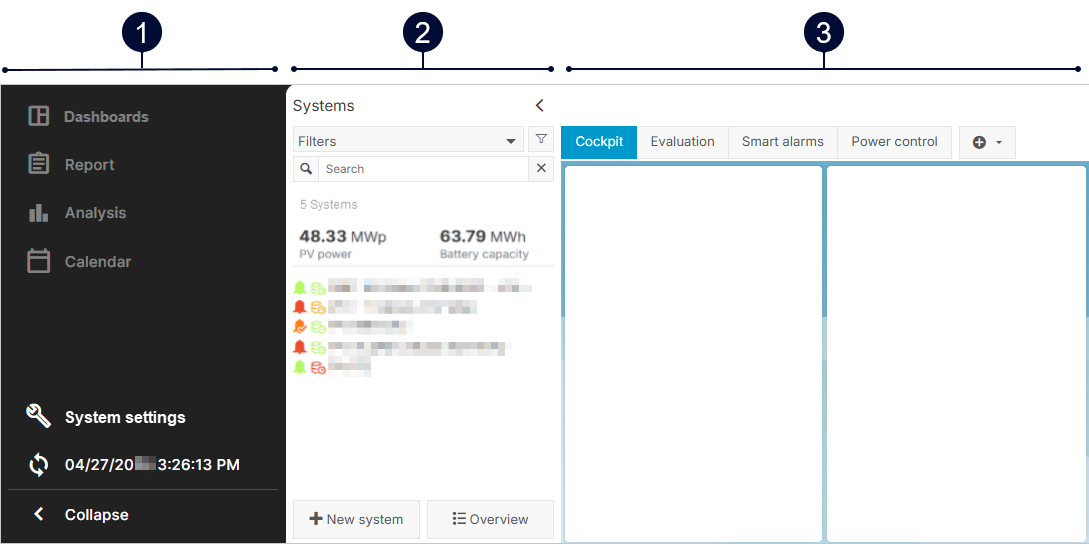
System level
|
Name |
Details |
|
|---|---|---|
|
1 |
Side bar with system-level settings |
Other actions are the same as at portfolio level. |
|
2 |
Systems list |
While at system level, select another system name to navigate to other system levels in your portfolio. Other actions are the same as at portfolio level. |
|
3 |
Content area |
The content area is organized in portlets and tabs. Select |