.svg)
Last modified:
Chart
View the chart at System level in the Evaluation tab in the Section: System KPIs.
Basic info
|
Description |
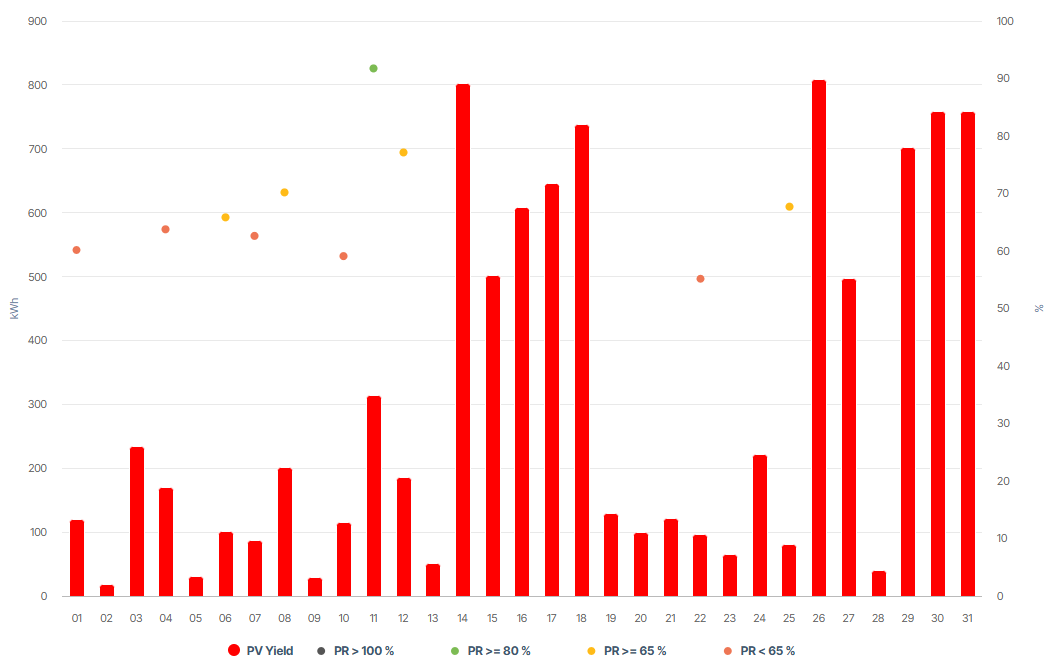
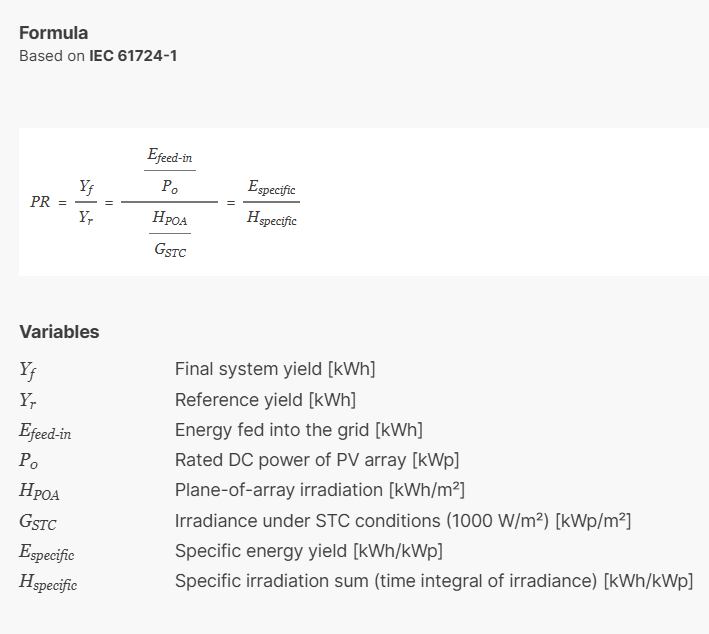
The performance ratio is calculated based on the actual generated energy (= system yield), installed DC power, and POAI/Plane-of-array irradiance. It indicates how well the PV system can convert solar energy. Typically, an annual PR value of 75-85% is considered good. In the chart, the bars represent the system’s normalized actual energy (PV Yield), and the dots represent the PR/Performance ratio. The color of the dots corresponds to the threshold specified for the rating of the PR. |
|---|---|
|
Prerequisites |
|
|
Further details |
Calculation
Editable calculation parameters
Default PR formula
|
Caution
If your site has multiple power plant controllers (blue’Log XC data loggers or third-party PPCs) and you want to monitor each individually, each controller should be configured as a separate system, not as a subsystem. Otherwise, the performance ratio will not be calculated.
Example: A site has PV production across three rooftops, each with its own PPC. In this case, configure each rooftop in VCOM as a separate system.
To view the overall PR for the entire site, you can combine these individual systems into a virtual system in VCOM.
If you require further assistance, contact Support.
Note
Find further information on the general functions within charts under Evaluations & charts.