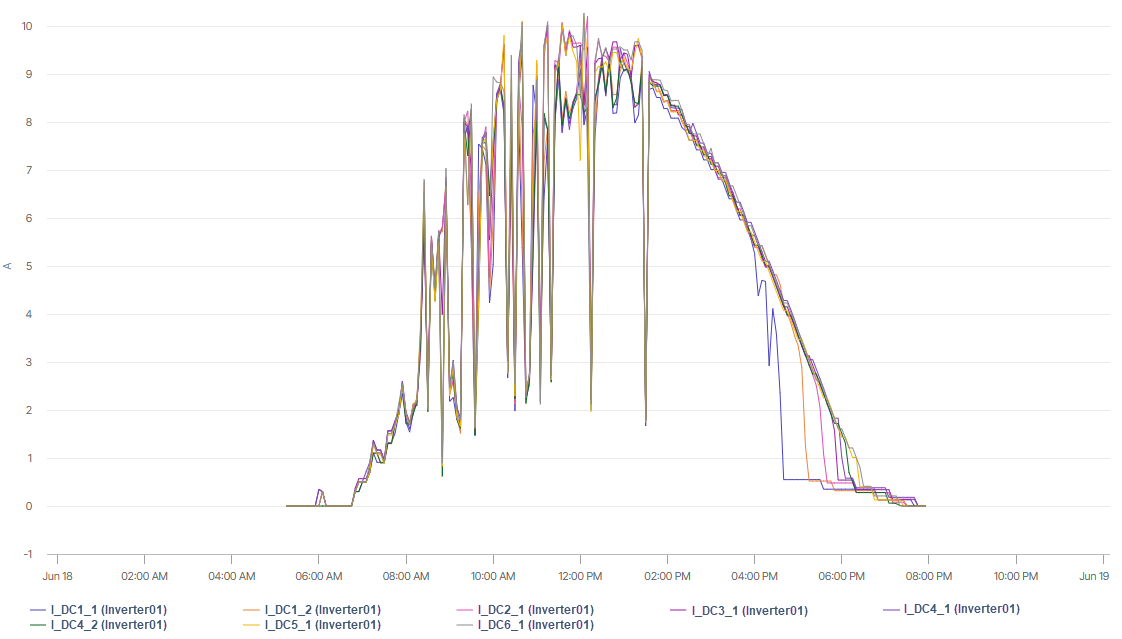
DC current chart for inverter inputs, displaying each input of the 6 MPPTs of one inverter in Day view
Basic info
Description
The chart allows you to monitor the DC current of each string of each inverter’s MPPT individually.
Prerequisites
Your system has string inverters and their inputs appear at system level under System settings > Data sources > [Data source name] > String inverter inputs.
All inverter input strings you want to be displayed are activated.
Further details
You can find the settings for string inverter inputs at System level under System settings > Data sources > [Data logger name] > String inverter inputs.
You can rename your inverter inputs. Default naming convention is: I_DCx_y (z)
x = MPPT
y = input
z = inverter
By default, only one inverter is selected to be displayed in the chart. You can change the selection manually.
Battery inverters are not included in this chart.
The chart is not available for systems with string combiner boxes.
Note
Find further information on the general functions within charts under Evaluations & charts.
.svg)