Last modified:
Basic info
|
Item in the Portlet center |

|
|---|---|
|
Description |
The performance overview portlet lists all the systems of your portfolio and gives an overview of all the information selected by the user. |
|
Prerequisites |
|
|
Portlet properties |
Static portlet: The portlet displays the same information regardless of the selected system.Portfolio portlet: The portlet can be added at the Portfolio Level . |
|
Further details |
Select |
Overview of the portlet
|
Name |
Description |
|
|---|---|---|
|
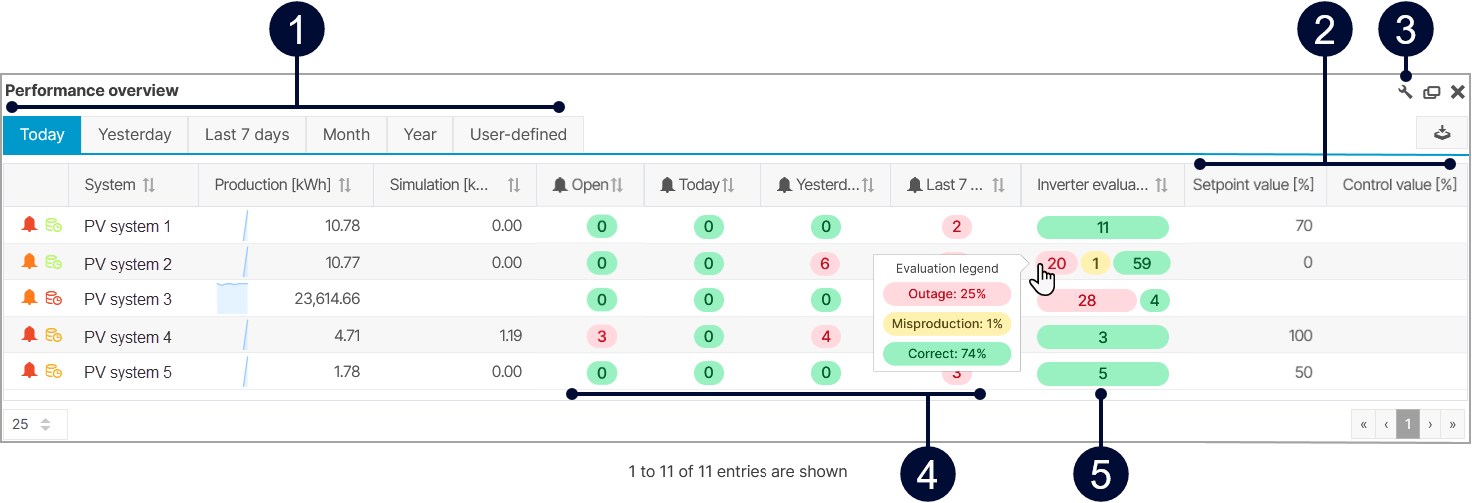
1 |
Tabs for period |
Select a time period for which you want to display the portlet’s information. Note Not all columns are available in all time periods. Check the column’s corresponding tool tip in the |
|
2 |
Power control values only in Today view |
Displays the setpoint value and control values. |
|
3 |
|
Decide which columns are displayed in the portlet. |
|
4 |
Alarms open and alarm overview |
Displays the amount of currently open alarms from the past week and all alarms for different time periods. |
|
5 |
Inverter evaluation only in Today view |
Displays the total number of inverters in three different stages. The stages are based on the system’s alarm settings. See also Smart alarms. The stages are the following:
Hover over the bars to display the respective percentages |
Note
Find further information on the general functions of a portlet on Portlets.