.svg)
Last modified:
In addition to the default charts and alarms, the portal also allows you to create user-defined charts and alarms to meet your specific battery monitoring needs. Use alarms to reliably detect issues, and use charts and heatmaps to understand and analyze the issues further.
This page lists examples for user-defined alarms, charts, and heatmaps to answer the most important battery monitoring questions:
-
Is the system safe?
-
Is the system operational?
-
How much energy is available?
-
What are the current trends?
Note
Be aware that the examples provided on this page are intended as general recommendations and are not an exhaustive list of monitoring configurations.
Every system and application should be individually evaluated—including potential edge cases—to determine the appropriate alarms, charts, heatmaps, and safety measures. Implementing the examples alone does not guarantee complete system safety or fault detection coverage.
Prerequisites
-
The data points mentioned in this page must be available in your system. See Available data points and categories.
-
Knowledge of your battery’s relevant thresholds. You can find this information in the respective data sheet.
Further actions
Combine charts and heatmaps into individual dashboards. See Examples: User-defined battery dashboards.
Is the system safe?
Set up alarms and charts to help you monitor system safety.
Warning
Depending on the technology, chemicals, and application used, additional or different alarms may be required to ensure system safety.
Over-/Undervoltage
Required data points:
-
Max cell voltage
B_U_CELL_MAX -
Min cell voltage
B_U_CELL_MIN -
Voltage DC (battery)
B_U_DC
Cause:
-
Overvoltage can be an indicator for damaged cells or faulty modules, cabling, or contactors.
Warning
Overvoltage indicates that your battery is overcharging. This can lead to cell damage, accelerated aging, fire hazards, or failure or damage on PCS DC side.
Undervoltage indicates that your battery enters deep discharge. This can lead to cell damage and accelerated aging.
Once voltage drops below your PCS’s minimum DC voltage threshold, it can be very challenging to reconnect the battery to the PCS.
Monitoring options:
-
alarm Set up a user-defined static alarm to get notified when the voltage falls outside of your battery’s safe upper operating range.
-
alarm Set up a User-defined static alarm to get notified when the voltage falls outside of your battery’s safe lower operating range.
-
chart Set up a User-defined chart to analyze cell voltage spreads across battery units to detect imbalances early.
Chart specifications:
-
Data points:
-
Batteries > Max cell voltage
B_U_CELL_MAX -
Batteries > Min cell voltage
B_U_CELL_MIN
-
-
Components: e.g. all racks in a container
-
View the chart in Day view
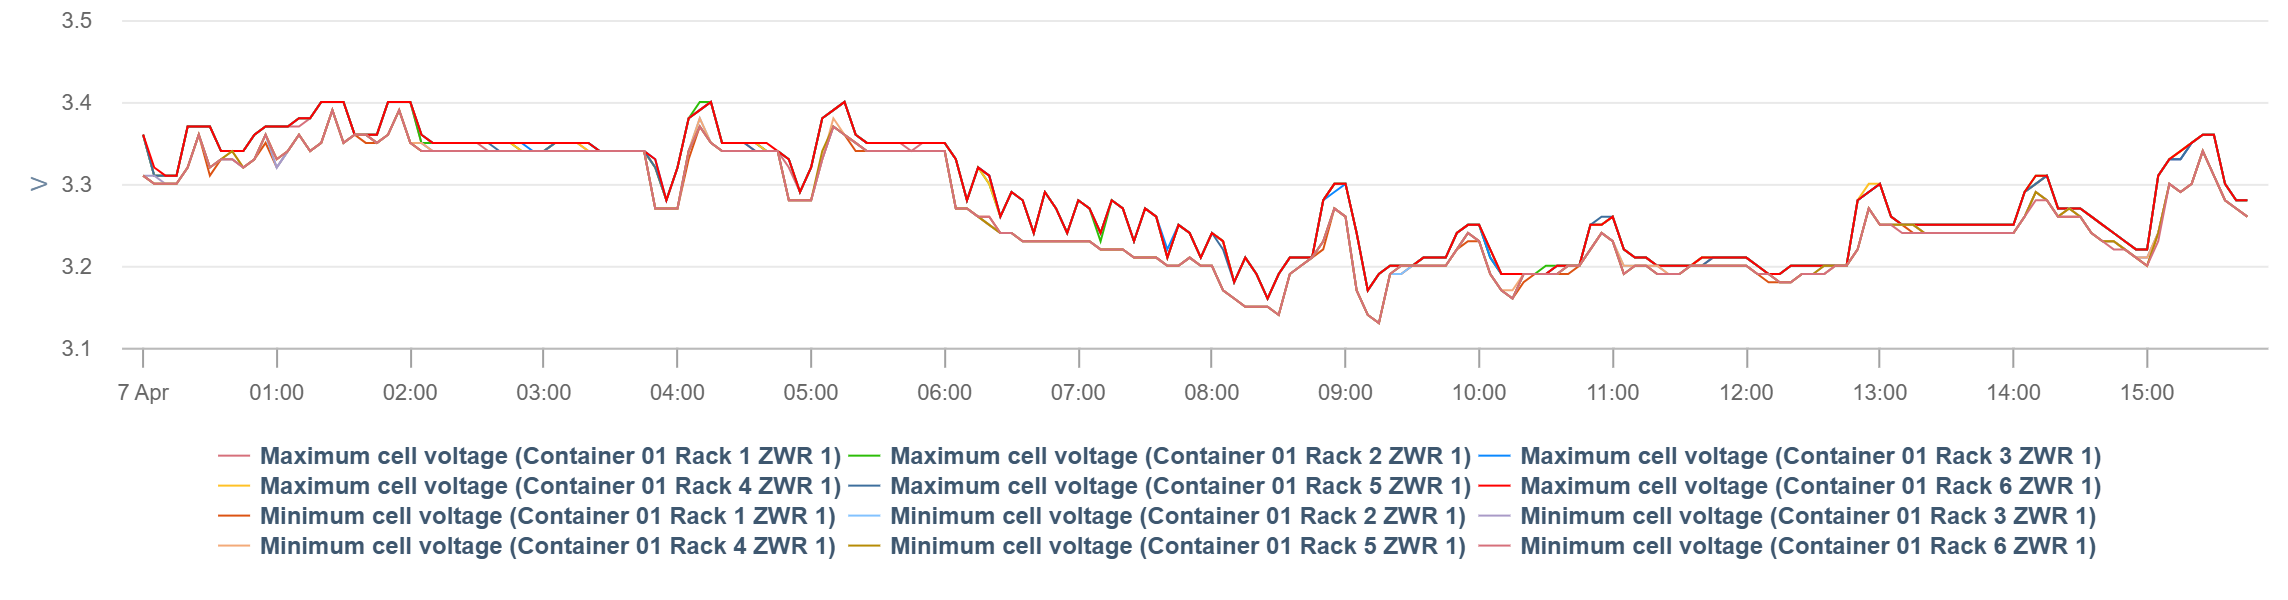
-
chart Set up a User-defined chart to analyze the aggregated DC voltage, for example, of a complete rack, to detect anomalies and support safe operation within PCS and battery voltage limits.
Chart specifications:
-
Data points: Batteries > Voltage DC
B_U_DC -
Components: e.g. all racks
-
View the chart in Day view
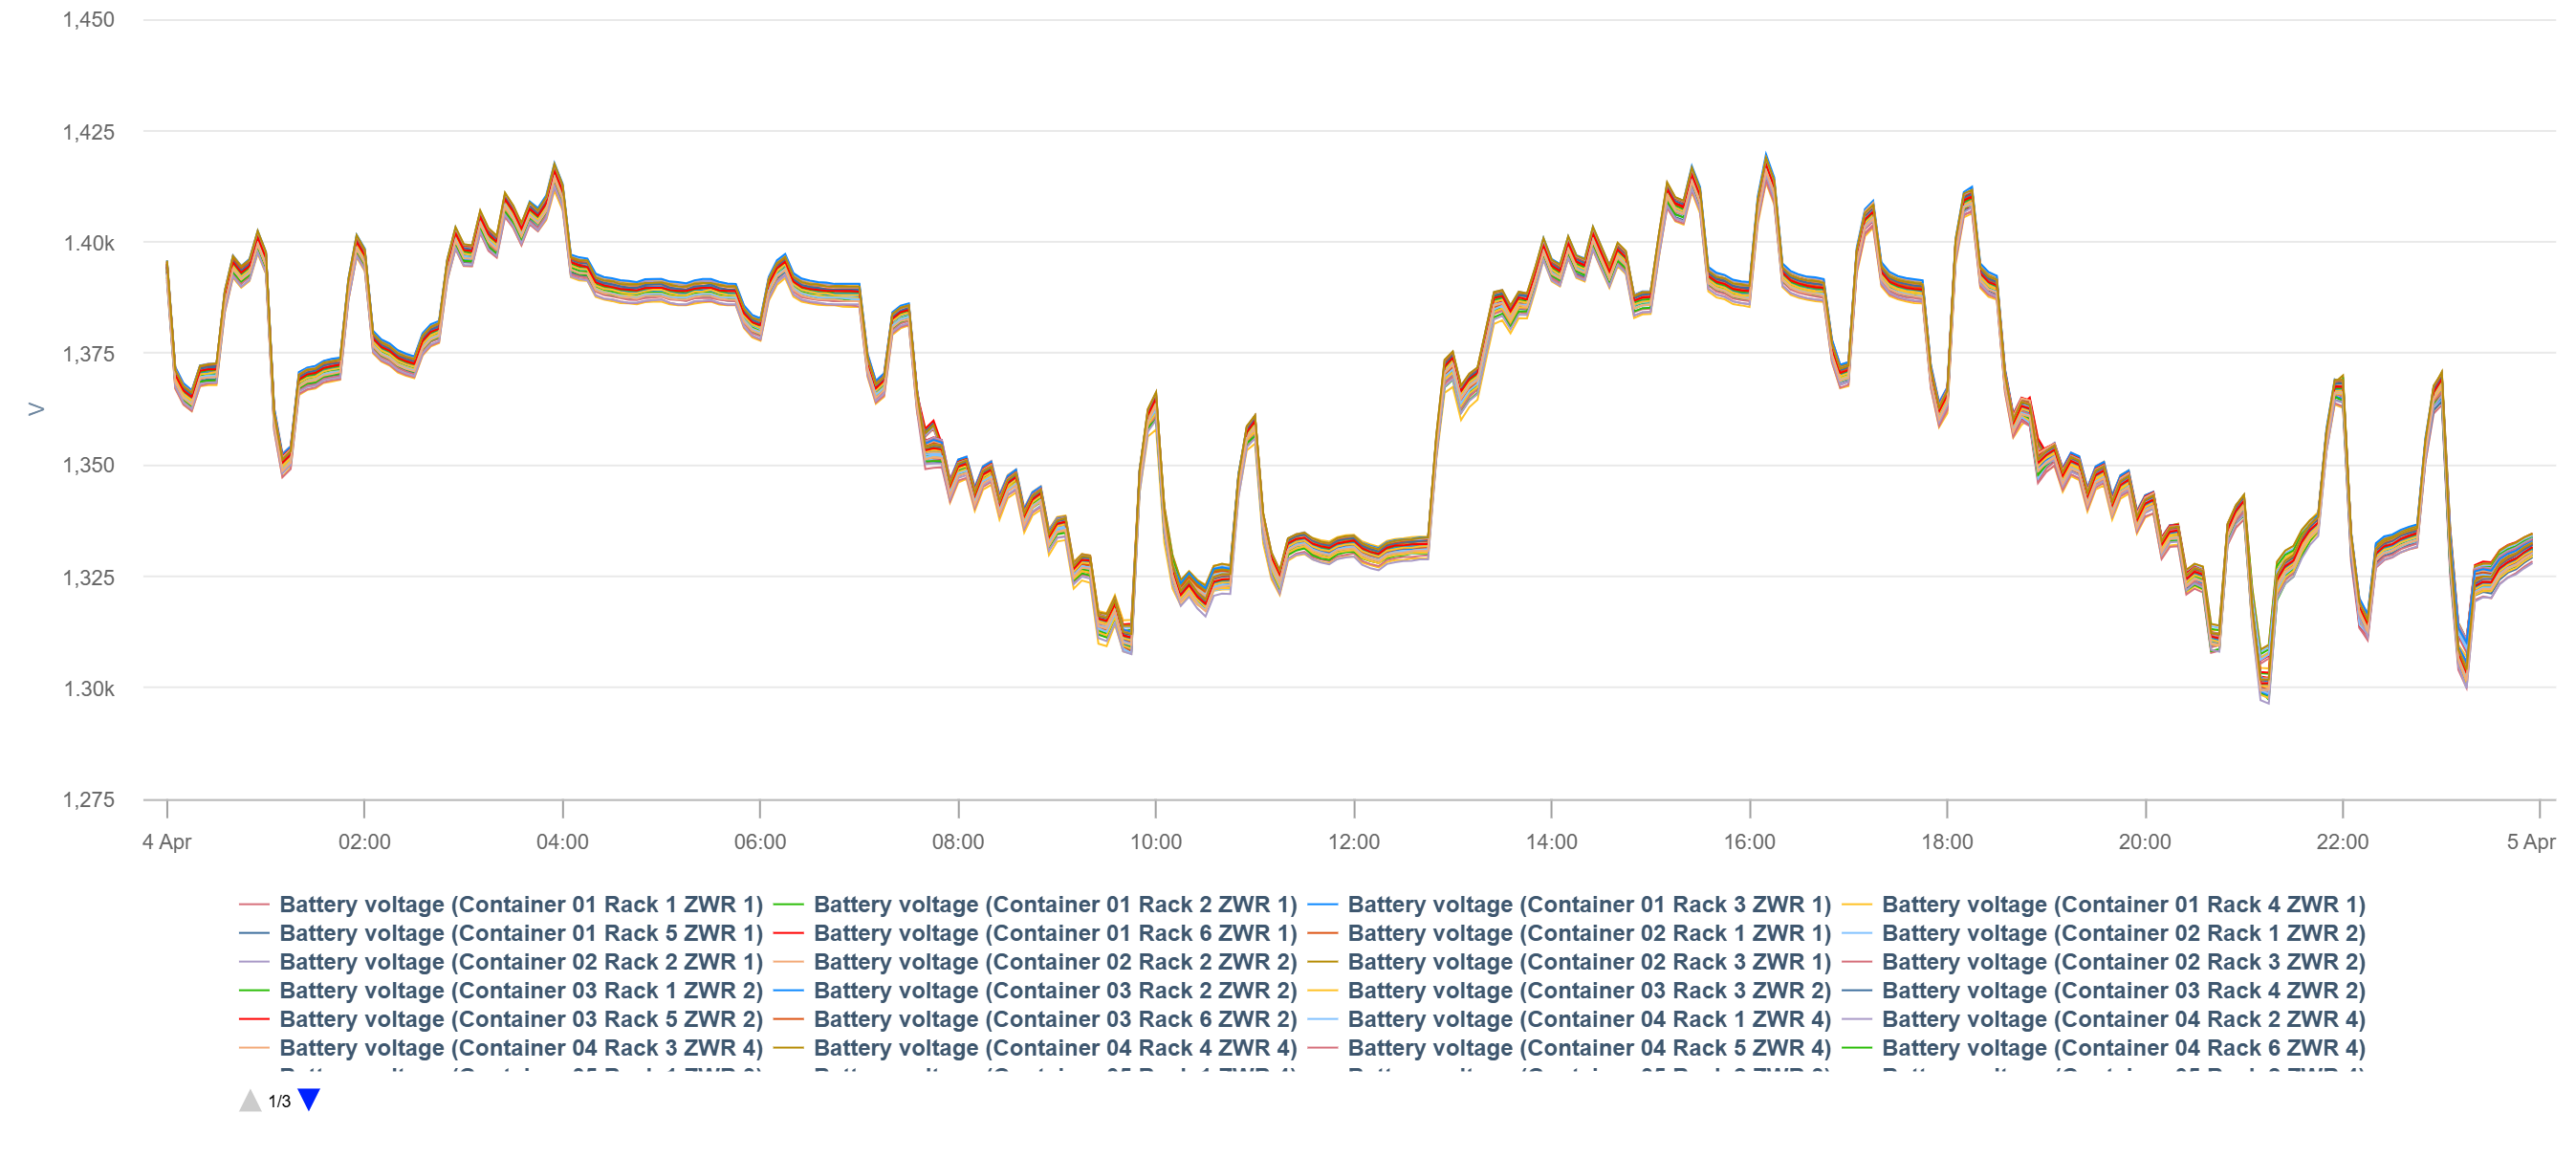
-
heatmap Set up a User-defined heatmap to monitor aggregated DC voltage.
Heatmap specifications:
-
Data points: Batteries > Voltage DC
B_U_DC -
Components: all possible, e.g. all racks within a container
-
View the heatmap in Day view
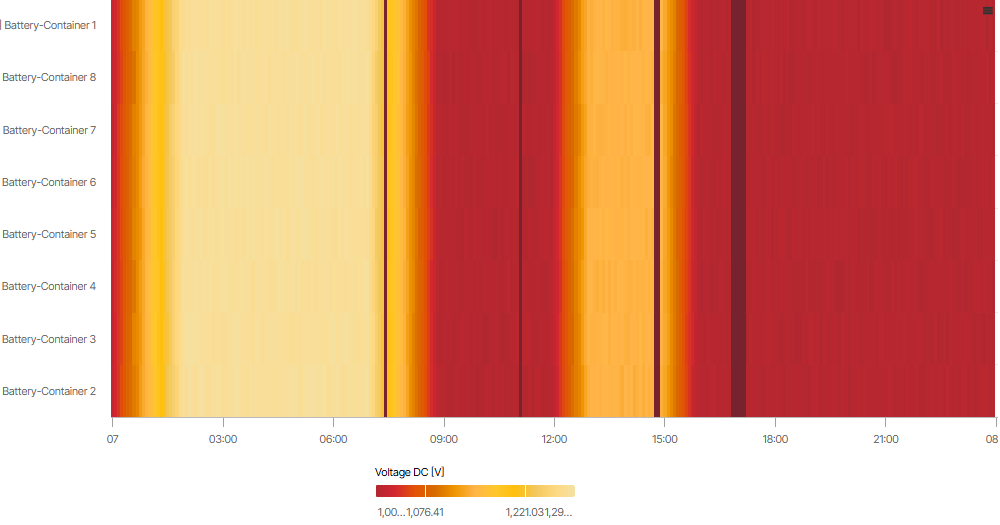
Over-/Undertemperature
Required data points:
-
Max cell temperature
B_T_CELL_MAX -
Min cell temperature
B_T_CELL_MIN -
Temperature (battery)
B_T
Cause:
-
Differences in cell temperature could indicate cell damage or cooling/heating issues.
Warning
Overtemperature can lead to thermal runaway, which can result in system failure and/or fire hazards.
If the temperature is above or below the operating temperature, the system may shut down.
Note
Undertemperature can lead to efficiency and lifetime loss.
Monitoring options:
-
alarm Set up a User-defined static alarm to detect and get notified when a cell's temperature inside a battery unit falls outside of the highest safe operating range.
-
alarm Set up a User-defined static alarm to detect and get notified when a cell's temperature inside a battery unit falls outside of the lowest safe operating range.
-
chart Set up a User-defined chart to analyze the cells’ min and max temperature within a battery unit at a glance.
Chart specifications:
-
Data points:
-
Batteries > Min cell temperature
B_T_CELL_MIN -
Batteries > Max cell temperature
B_T_CELL_MAX
-
-
Components: all possible, e.g. all racks within a container
-
View the chart in Day view
.png?cb=f9e2b37de8fbbdfbf1b3198ba064d581)
-
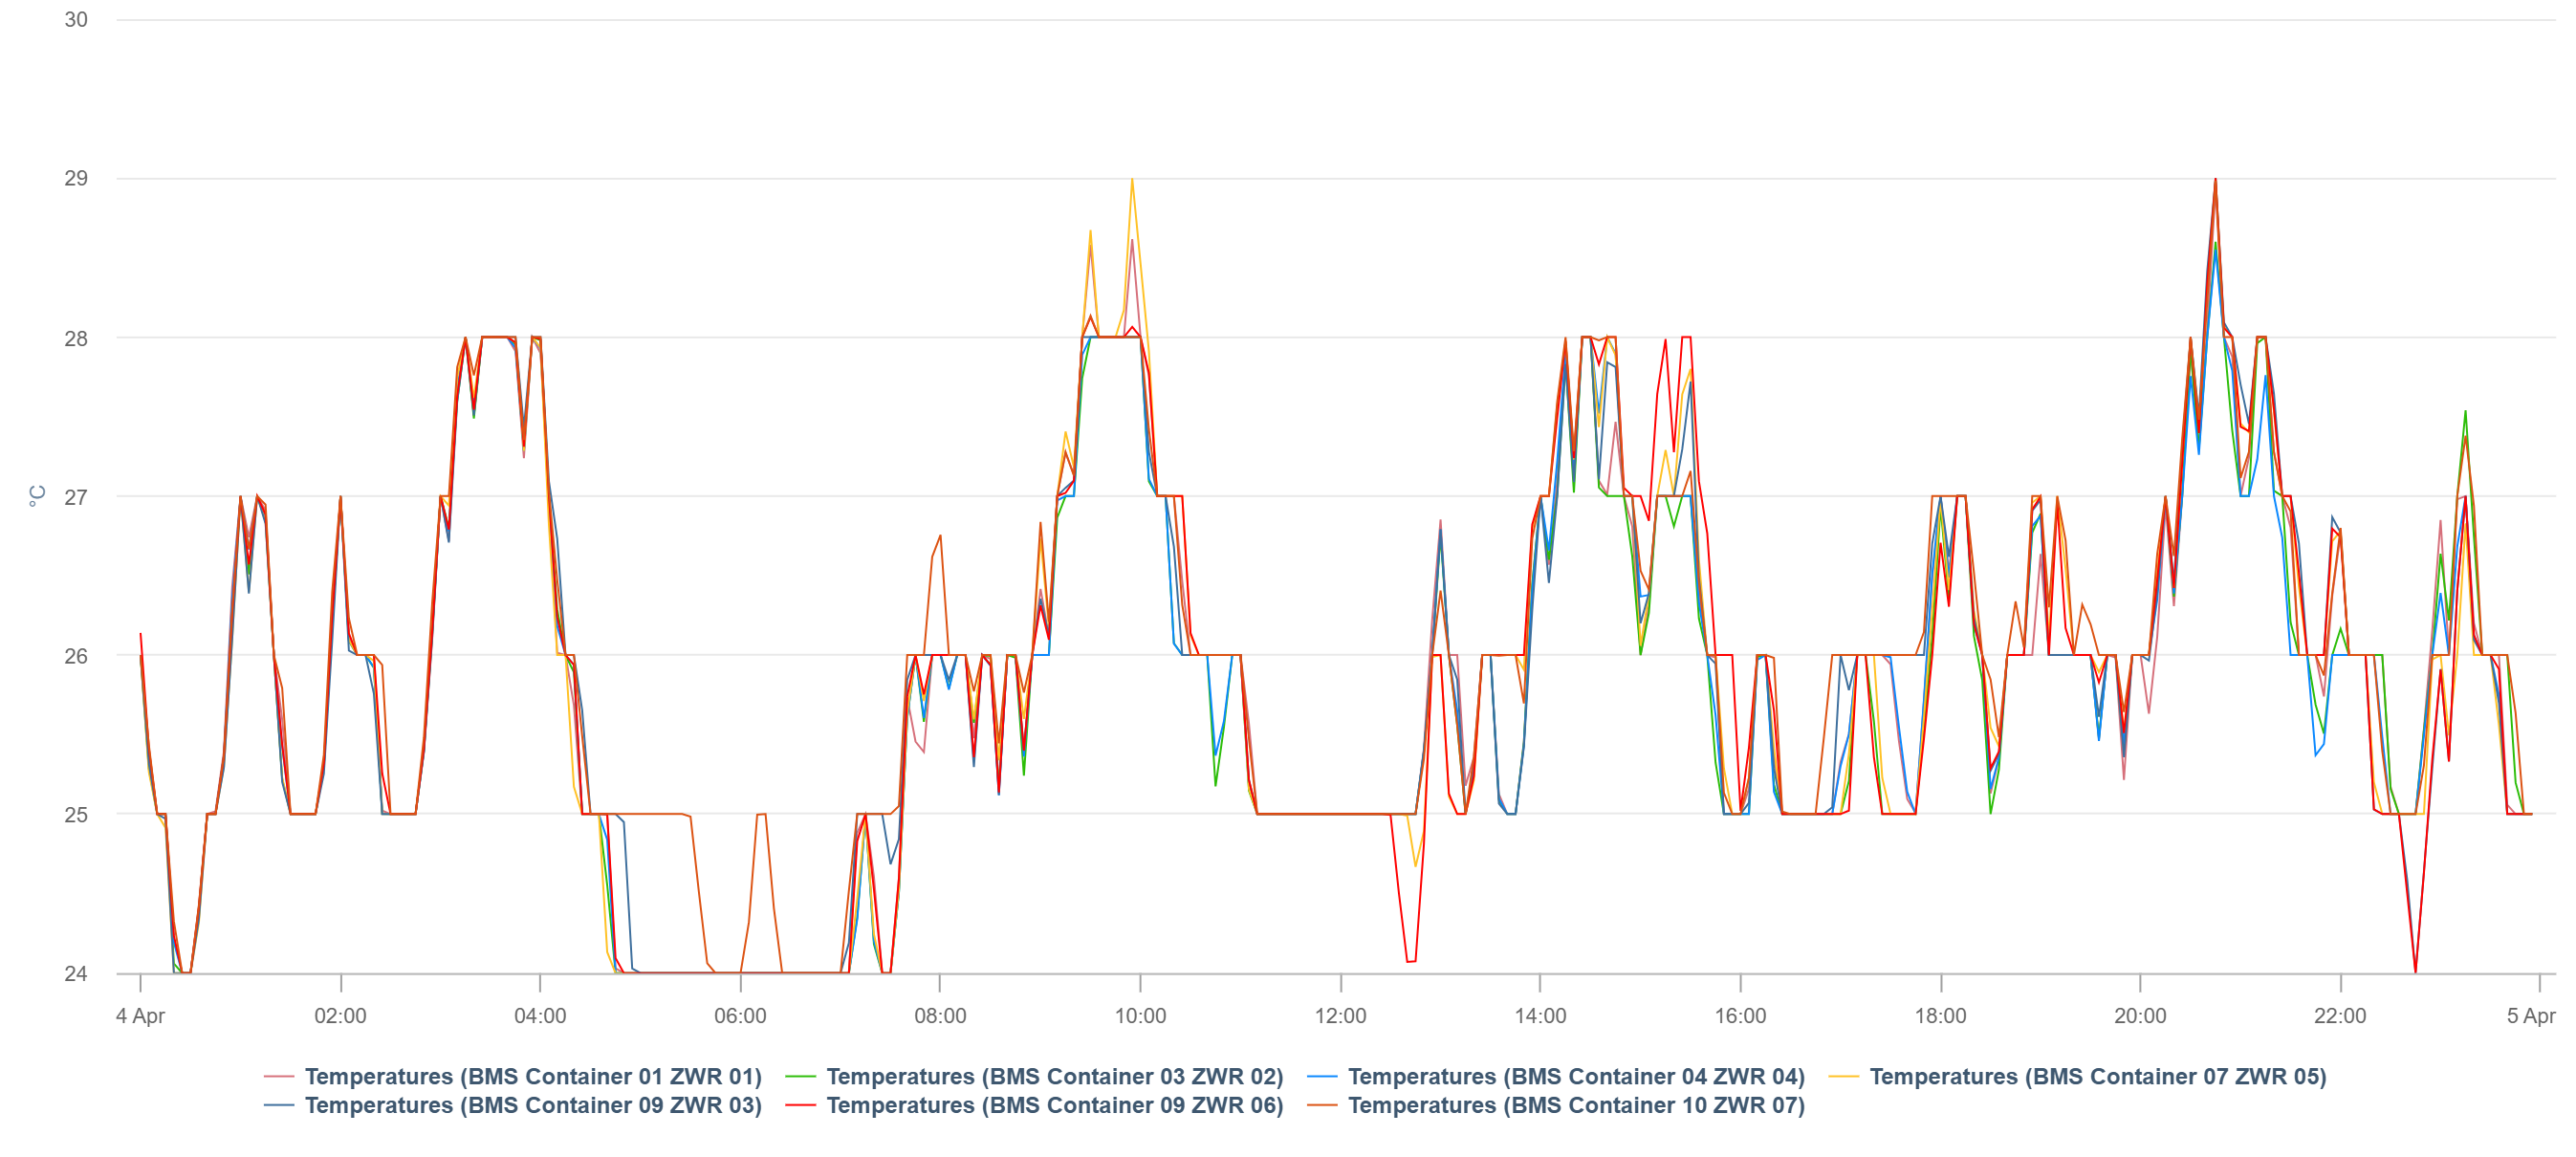
chart Set up a User-defined chart to analyze the battery temperatures within a battery unit, for example, a container. The temperature is influenced by heat dissipation from the battery cells, HVAC performance, and external weather influence.
Chart specifications:
-
Data points: Batteries > Temperature
B_T -
Components: e.g. all containers
-
View the chart in Day view
Note
Not all B_T values are necessarily comparable. Check which B_T values correspond to the ambient temperature.
Charging/Discharging imbalance
Required data points:
-
Current DC (battery)
B_I_DC
Note
Imbalanced charging and discharging is a risk for overheating.
Causes:
-
Imbalanced charging and discharging currents could indicate poor electrical contacts or connectors, or differences in the battery cells' internal resistance.
-
Could also indicate uneven load distribution.
Action:
-
If imbalanced charging and discharging currents occur regularly, maintenance is required.
Monitoring options:
-
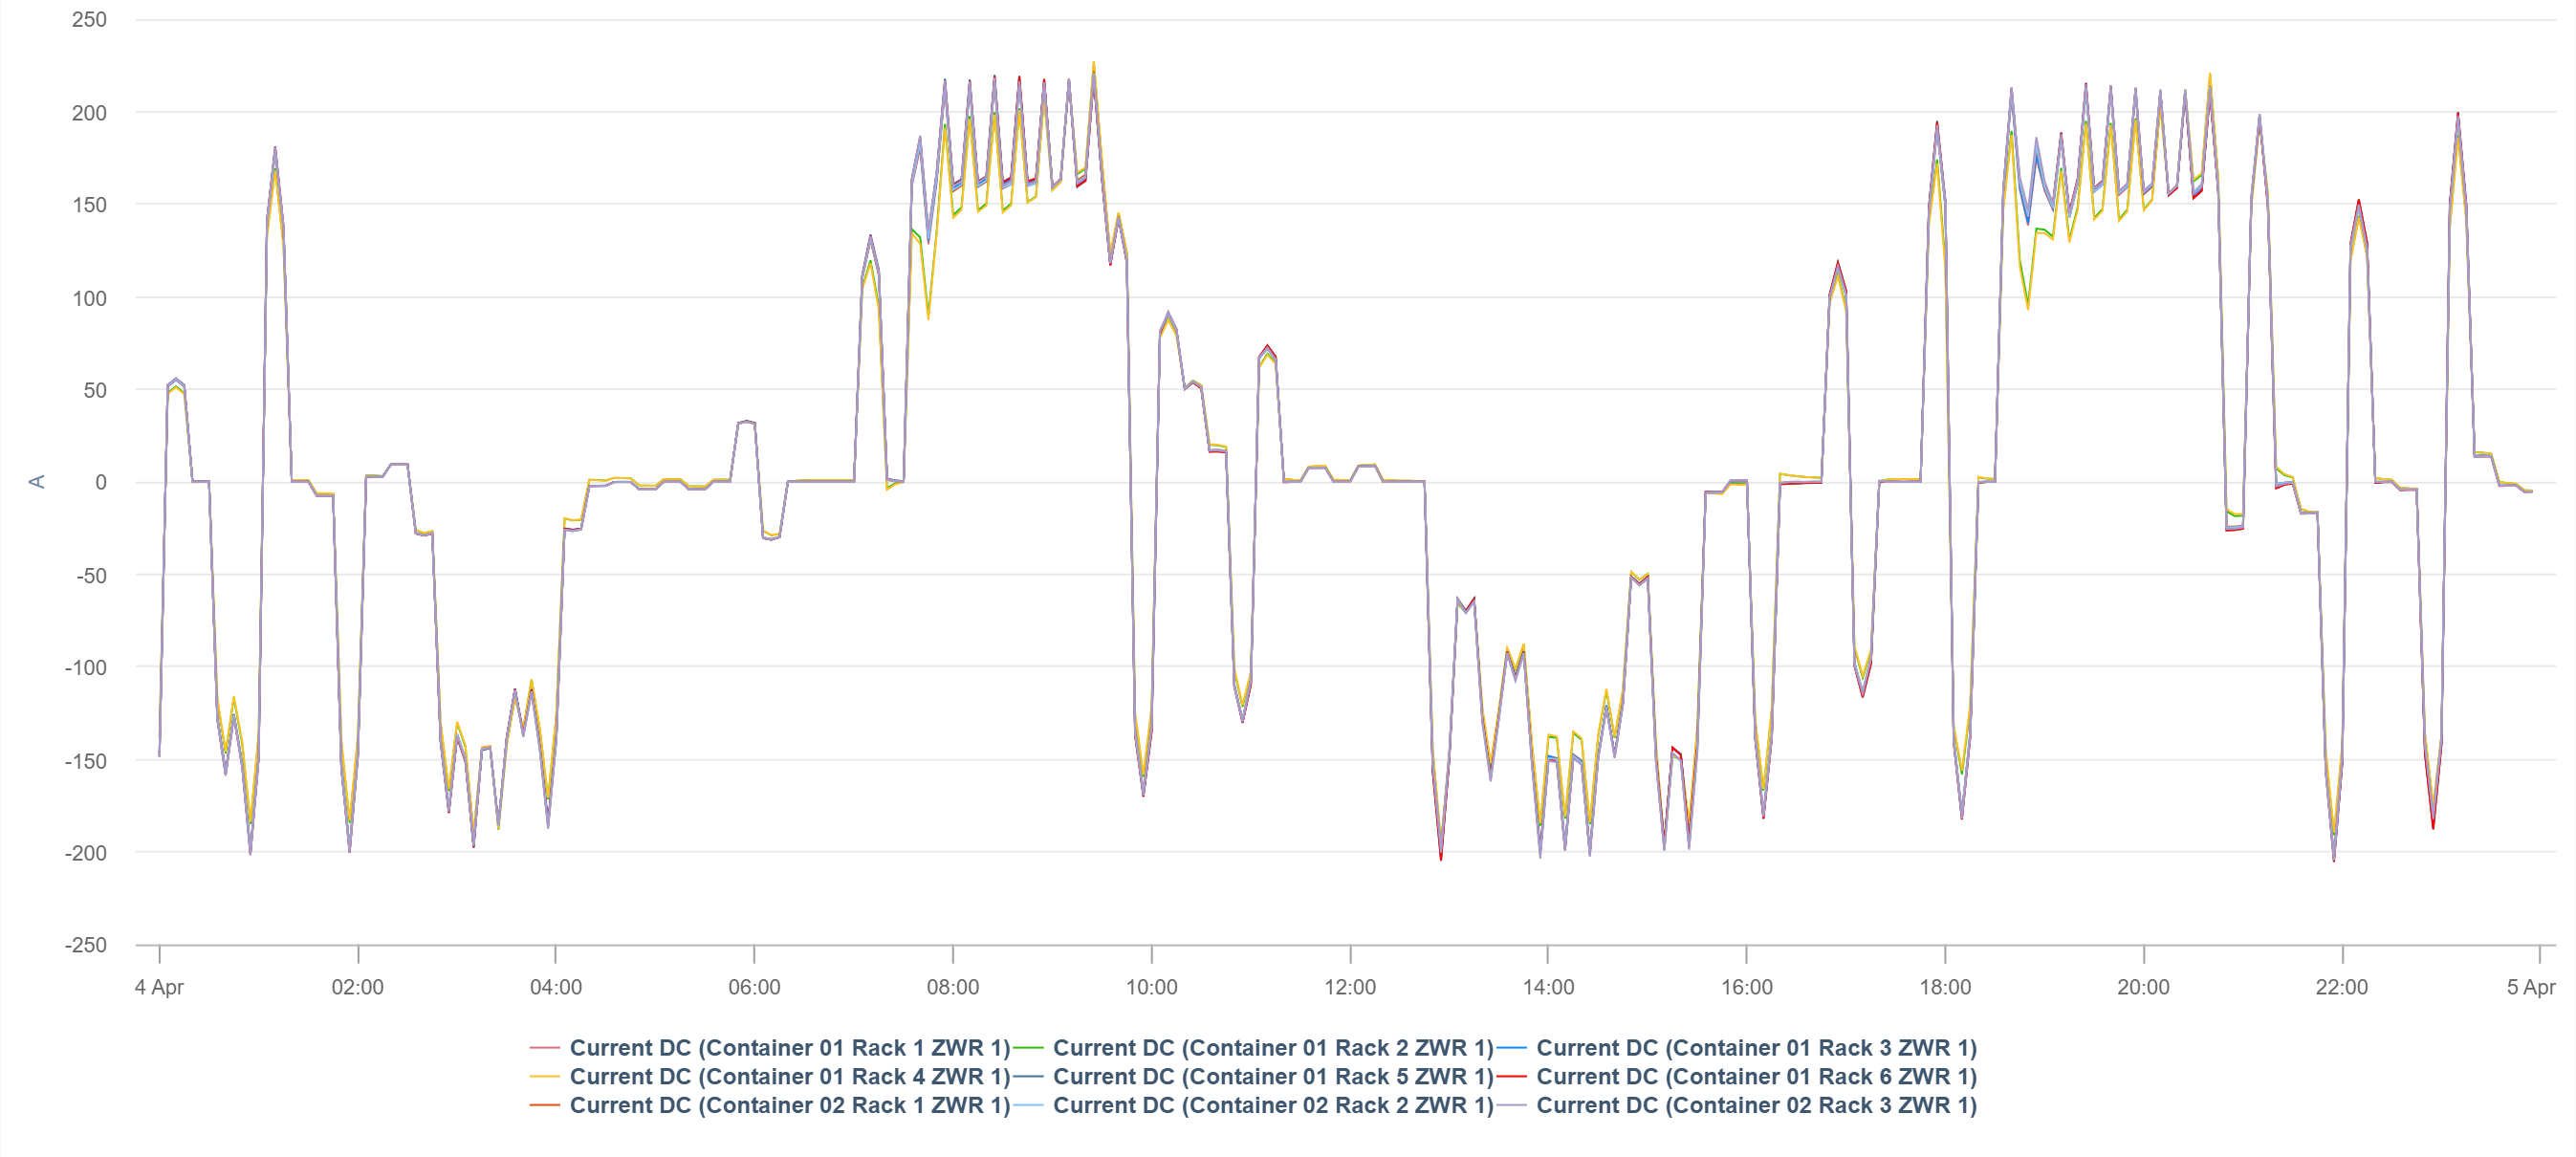
chart Set up a User-defined chart to analyze the load distribution and activity over time.
Chart specifications:
-
Data points: Batteries > Current DC
B_I_DC -
Components: e.g. all racks
-
View the chart in Day view
-
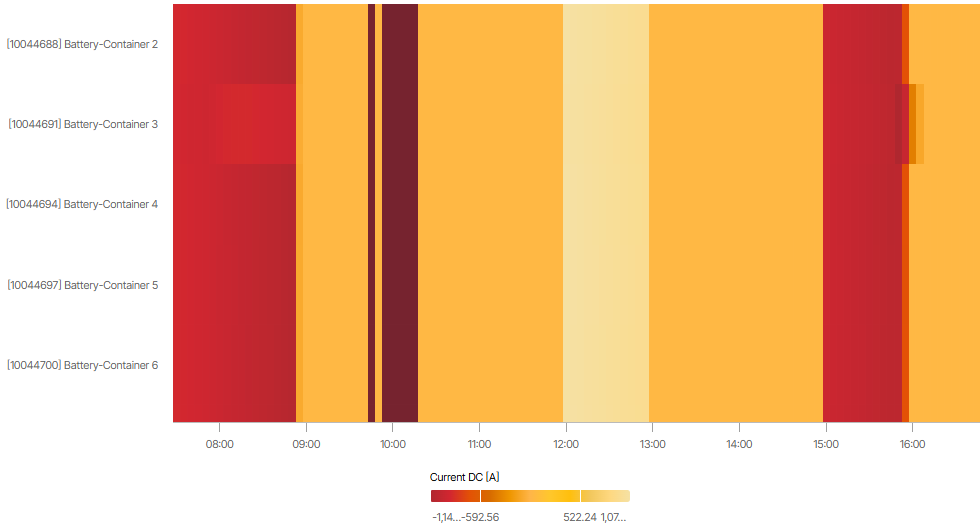
heatmap Set up a User-defined heatmap to spot uneven DC currents across battery units at a glance.
Heatmap specifications:
-
Data points: Batteries > Current DC
B_I_DC -
Components: all possible, e.g. all containers
-
View the heatmap in Day view
Is the system operational?
Find out whether your system is ready for use.
Required data points:
-
Battery system status
STATE[1..x] -
Latest battery error code within the interval
ERROR[1..x]
Note
Status and error codes have different meanings and can have different states depending on the battery type. Familiarize yourself with the codes specific to your battery so you can interpret the chart accordingly.
Monitoring options:
-
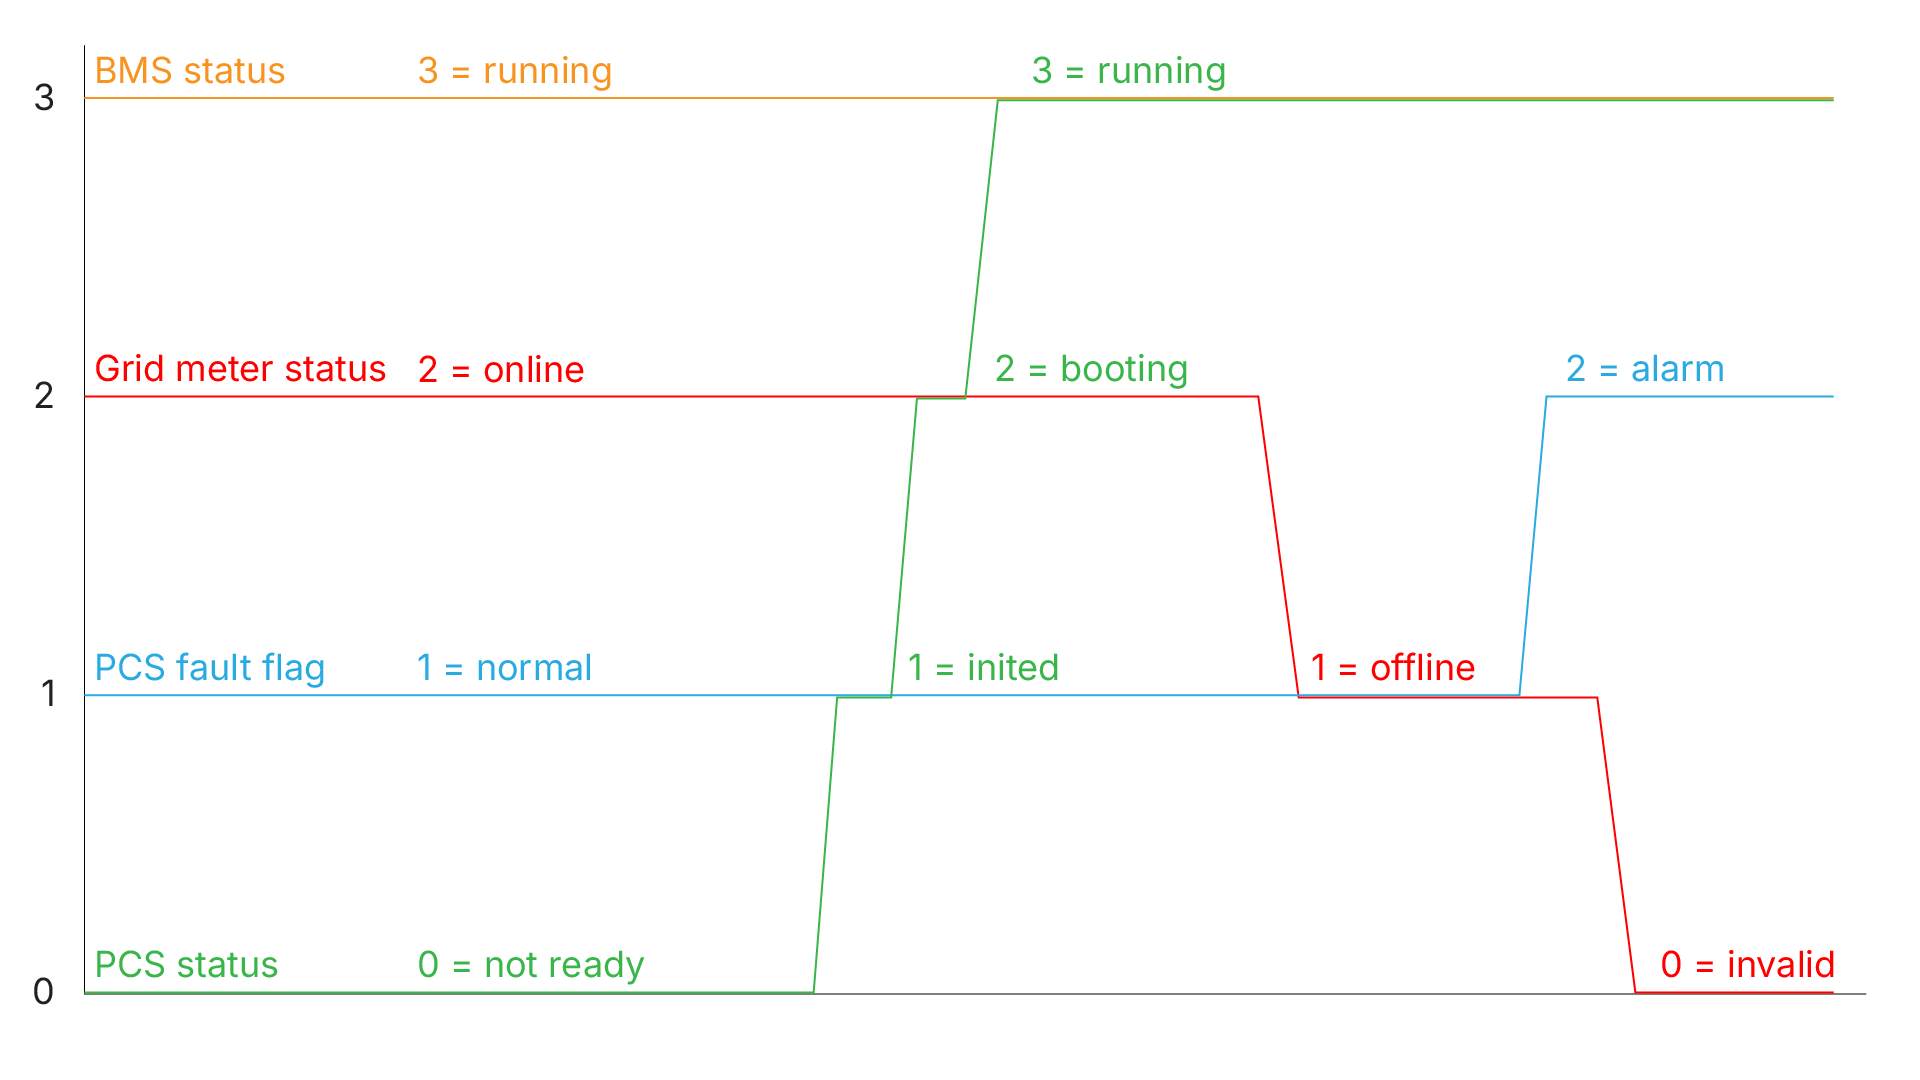
chart Set up a User-defined chart to analyze the battery’s status and error codes provided by the battery units.
-
blue'log only You can replace this chart with the Device events portlet.
Chart specifications:
-
Data points:
-
Batteries > Battery system status
STATE[1..x] -
Batteries > Latest battery error code within the interval
ERROR[1..x]
-
-
Components: all batteries
How much energy is available?
Analyze how much energy is/can be used right now.
Required data points:
-
Power AC (battery)
P_AC -
Chargeable energy AC
B_E_CHARGE_ACand dischargeable energy ACB_E_DISCHARGE_AC
Monitoring options:
-
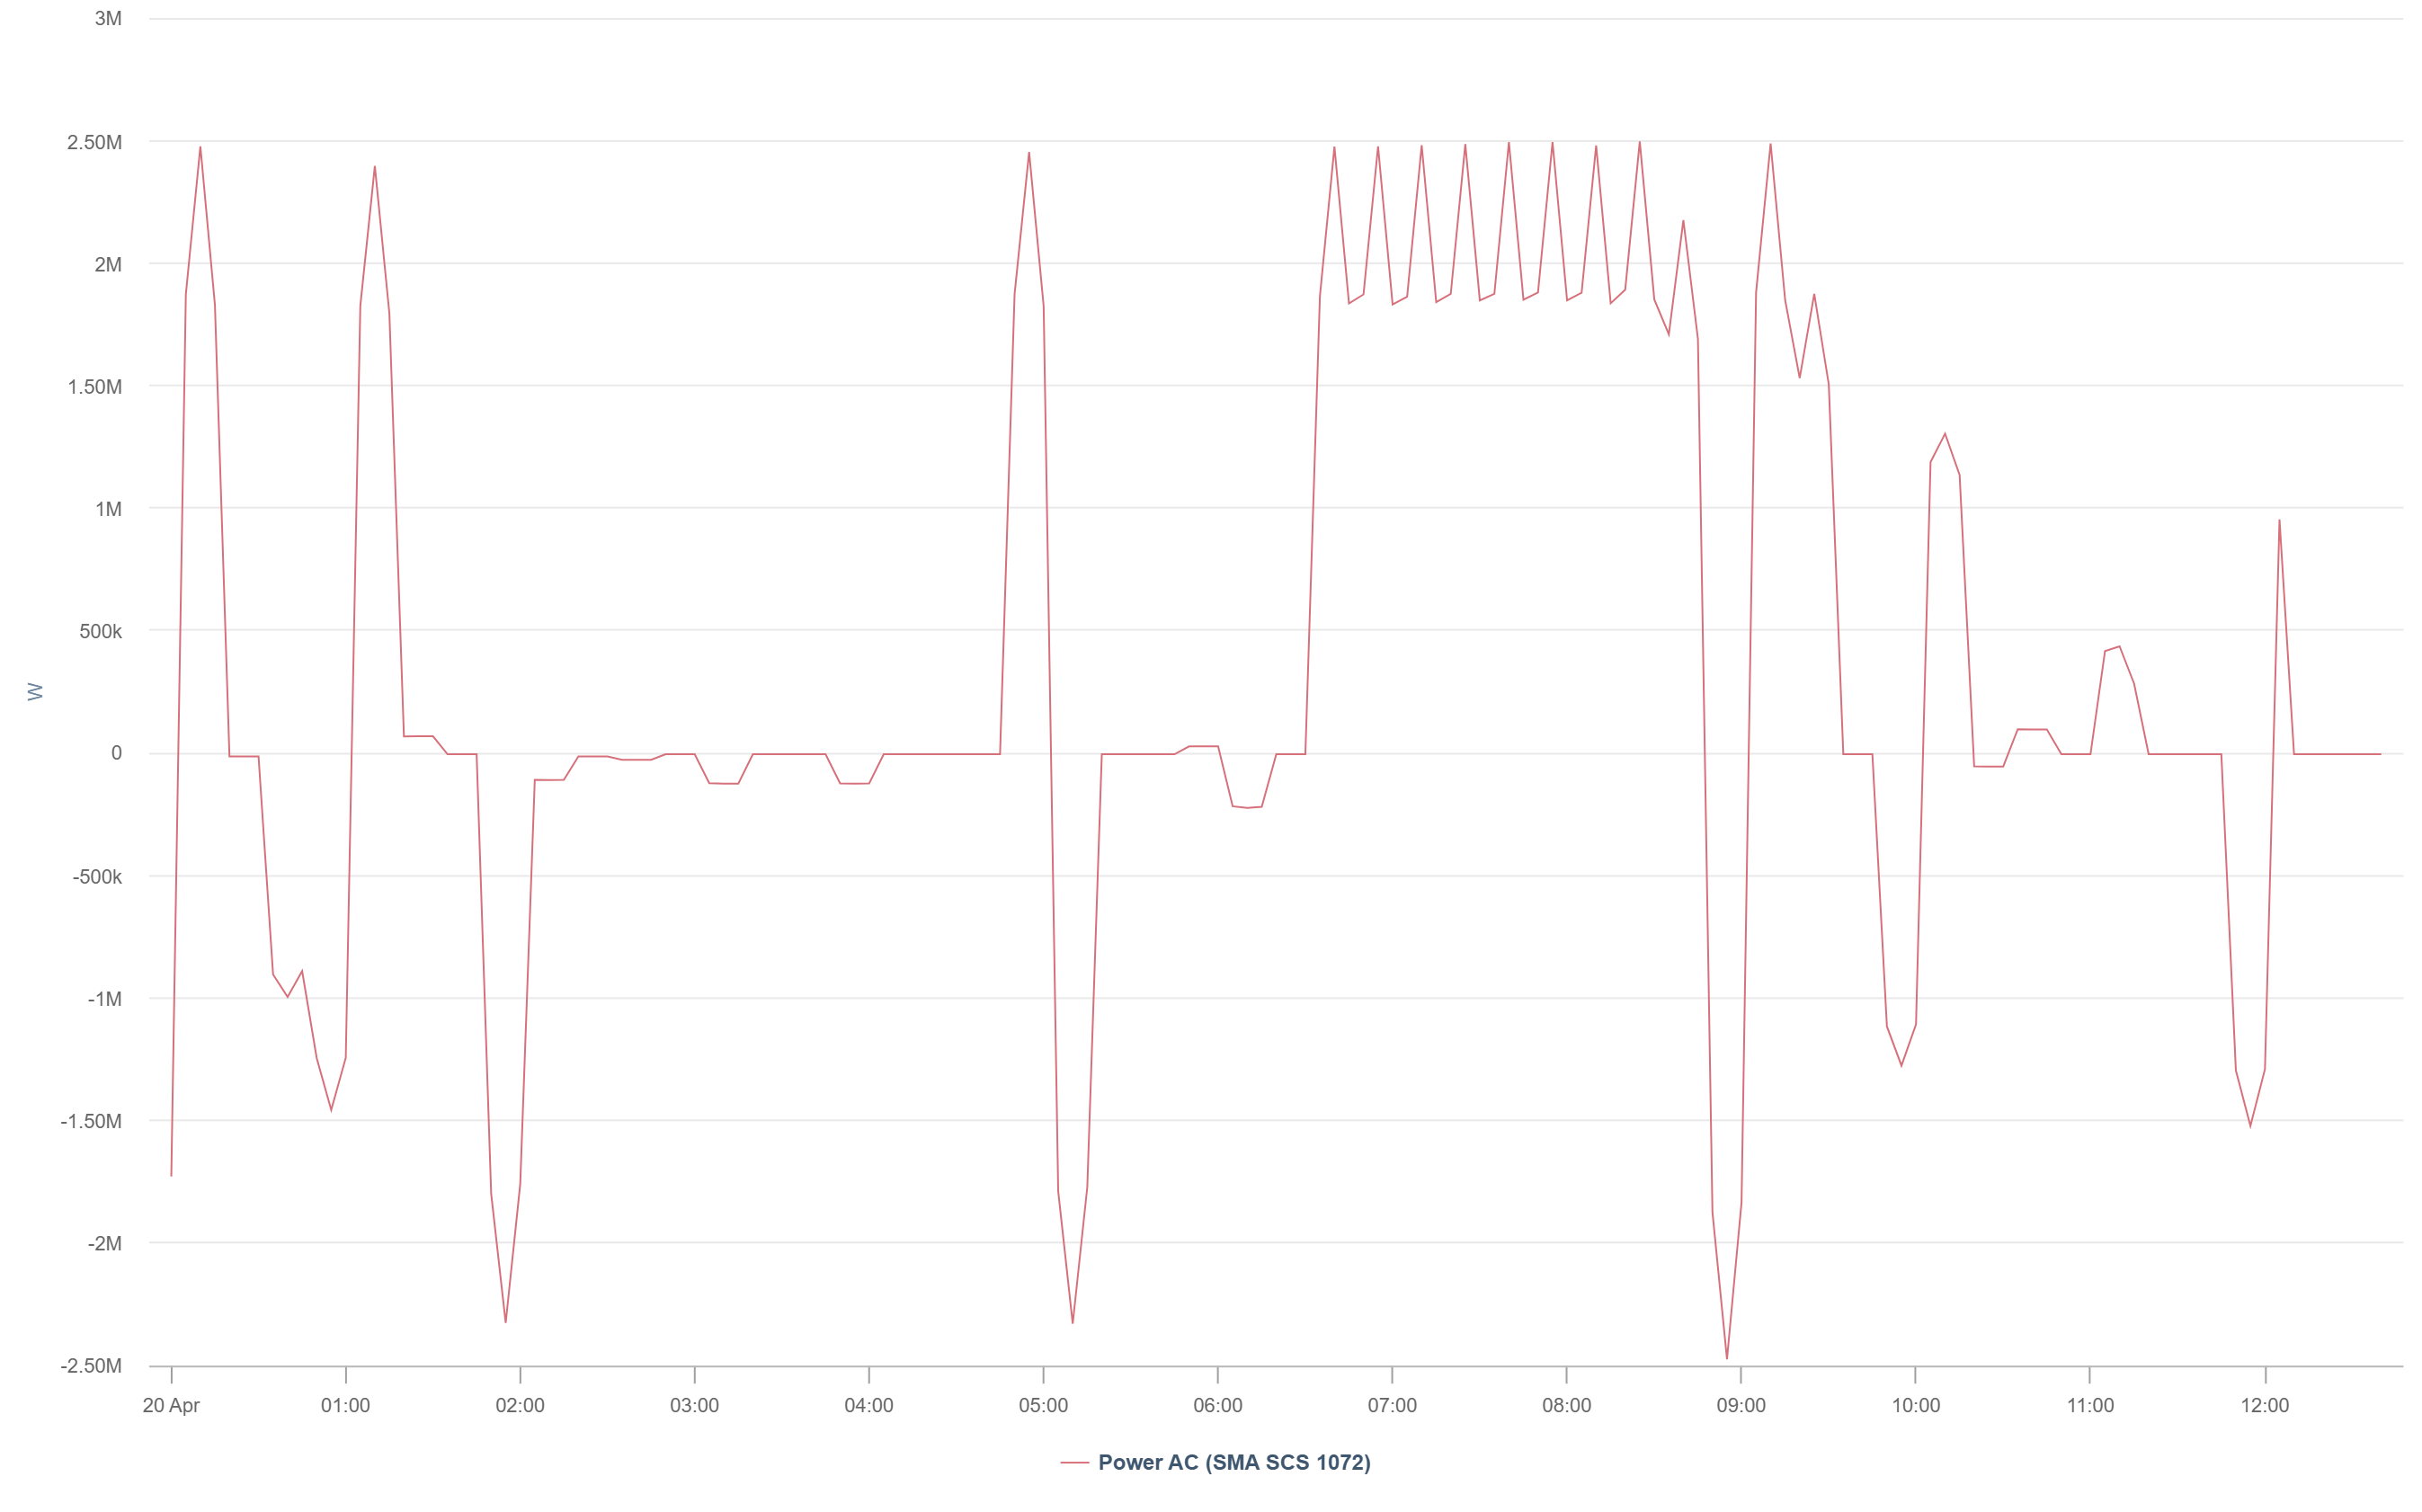
chart Set up a User-defined chart to analyze the actual power at PCS (AC side).
This helps you to:-
Detect unexpected power drops, clipping, or asymmetric behavior.
-
Confirm expected power profiles, for example, peak shaving, trading, grid services.
-
Chart specifications:
-
Data points: Batteries > Power AC
P_AC -
Components: all PCS
-
View the chart in Day or Week view
-
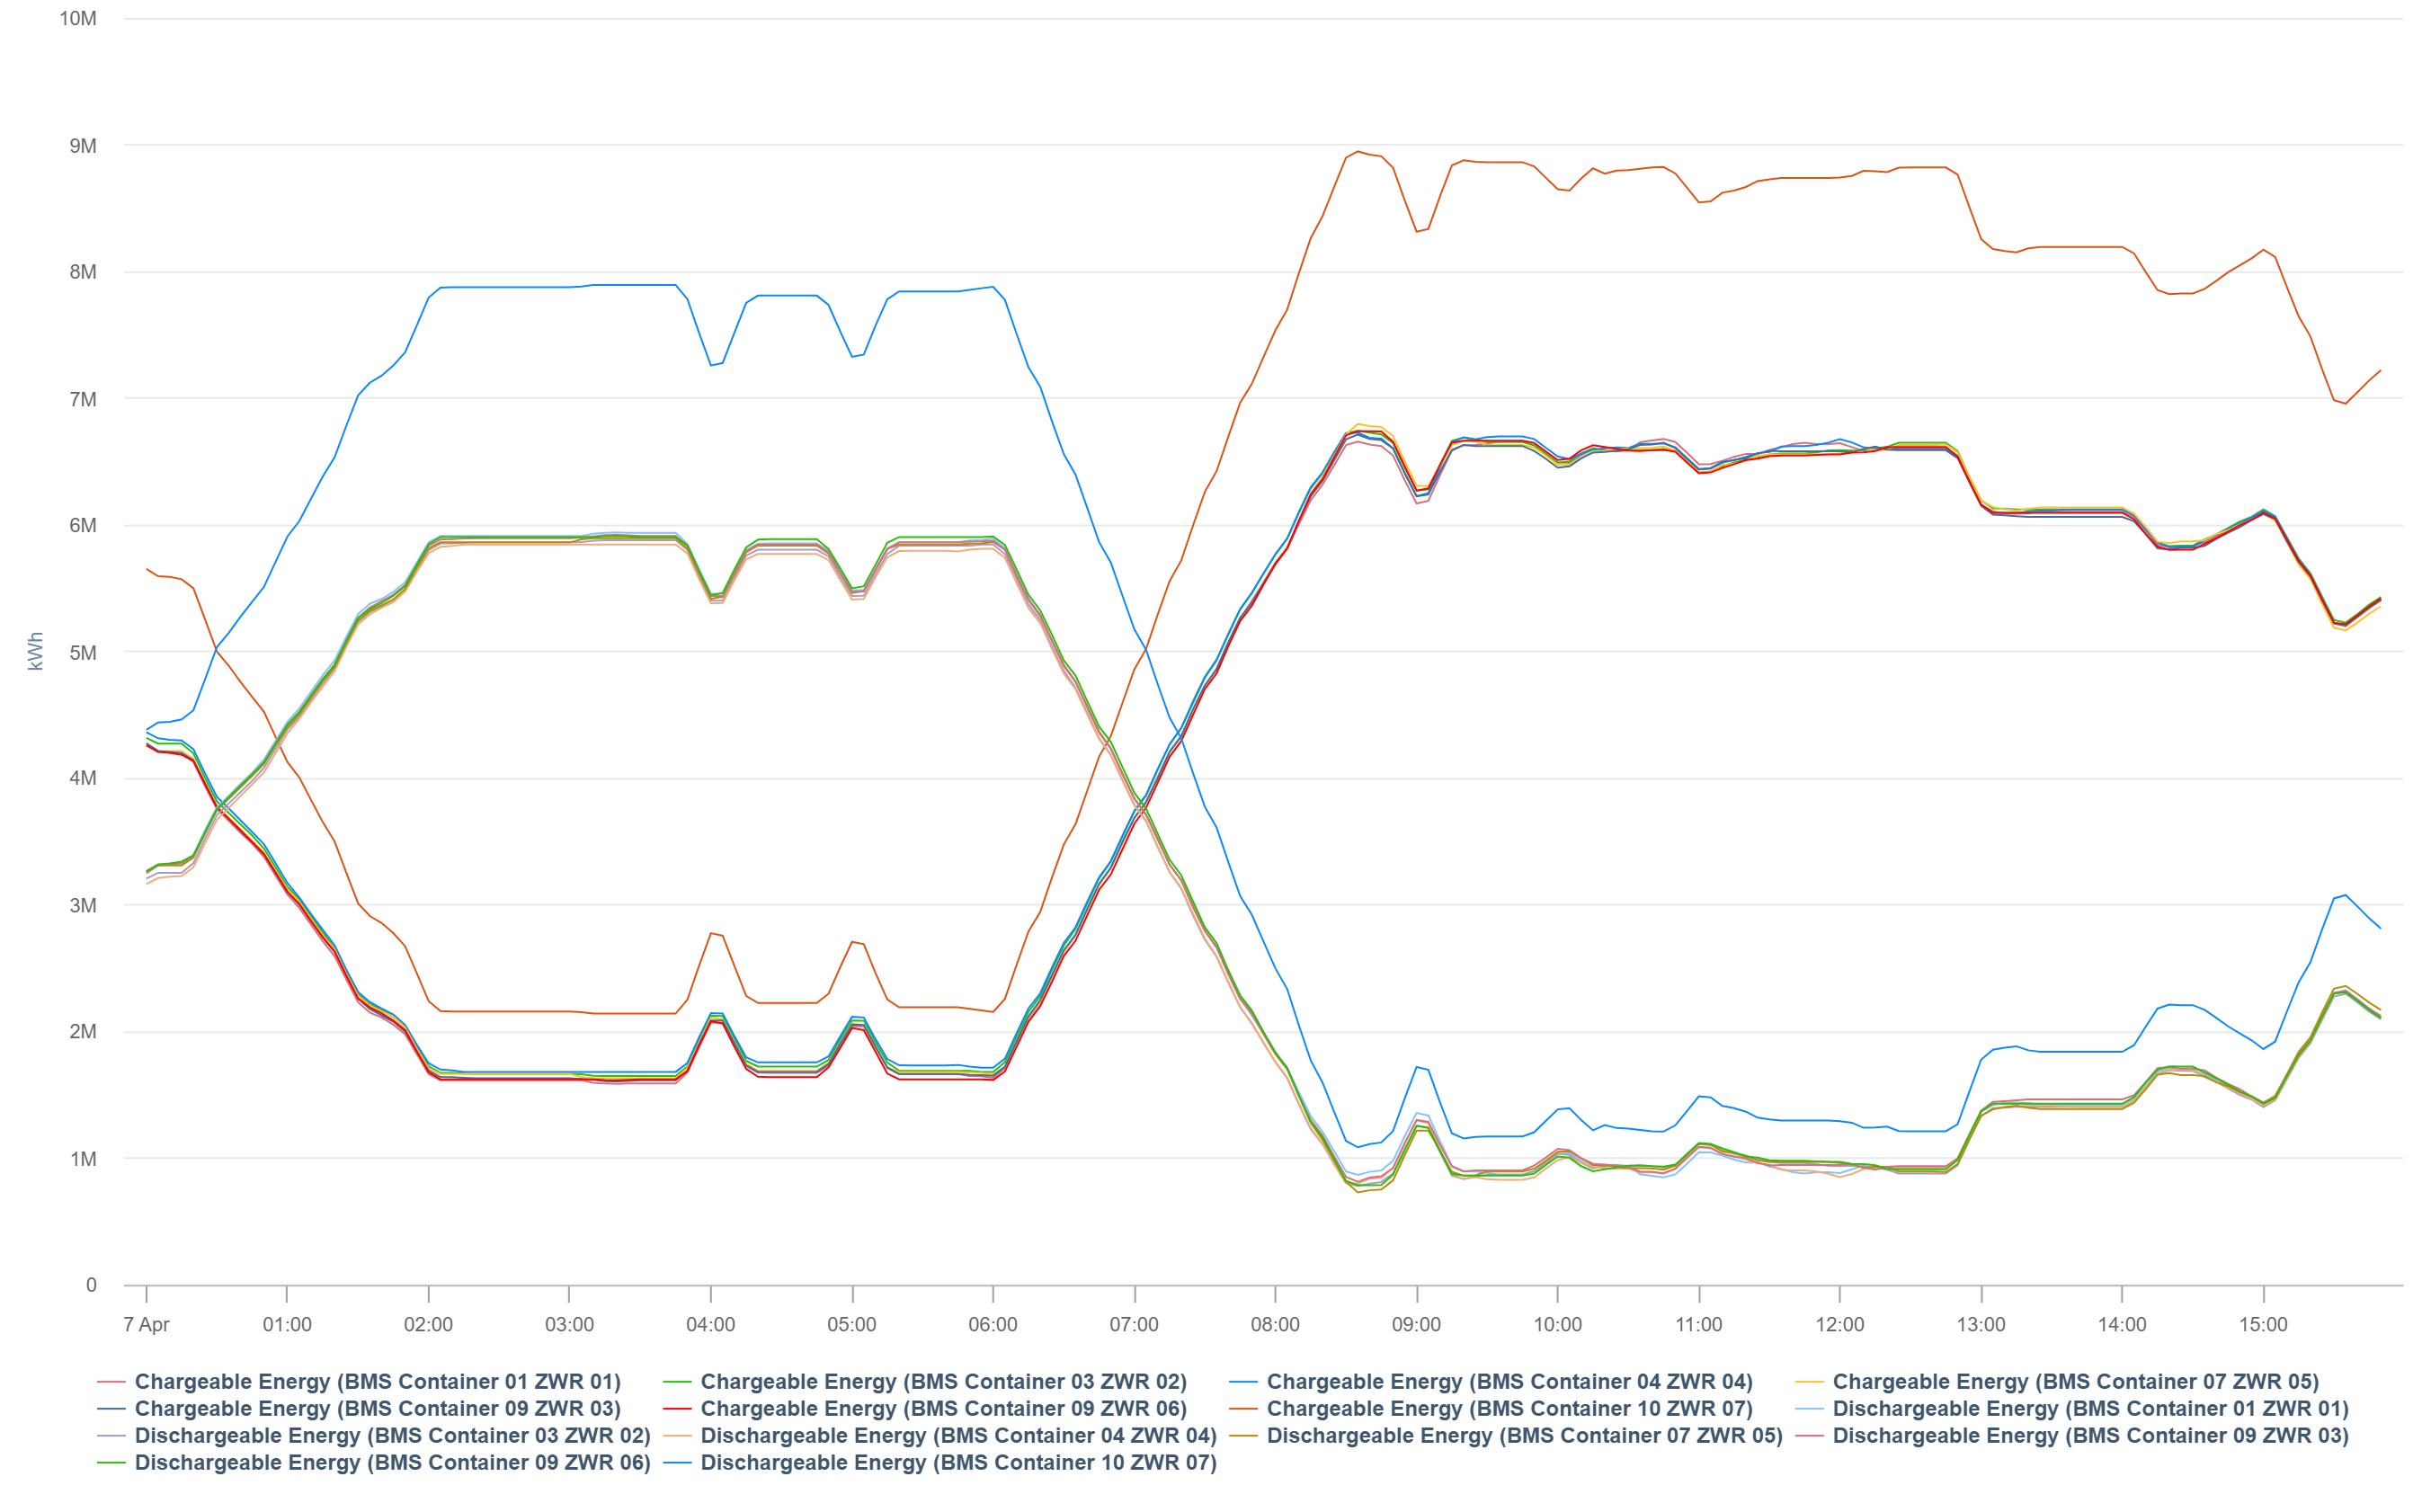
chart Set up a User-defined chart to analyze the usable energy per battery container beyond raw SoC.
This helps you to:-
Verify whether the battery could operate, even if it was not.
-
Chart specifications:
-
Data points:
-
Batteries > Chargeable energy AC
B_E_CHARGE_AC -
Batteries > Dischargeable energy AC
B_E_DISCHARGE_AC
-
-
Components: all containers
-
View the chart in Day or Week view
Tip
If AC energy is not available, use DC energy instead B_E_CHARGE_DC and B_E_DISCHARGE_DC.
What are the current trends?
Set up alarms and charts to stay informed about recent developments.
SoC/State of charge imbalance
Required data points:
-
SoC/State of charge
B_SOC
Action:
-
If you detect a large SoC spread, check if a balancing and/or SoC recalibration task is required.
Caution
A large SoC spread across battery units reduces the usable capacity, resulting in inefficient operation, lower revenue, and shorter battery lifetime.
Monitoring options:
-
alarm Set up a User-defined comparison alarm to detect and get notified about unusual SoC deviations.
-
heatmap Set up a User-defined heatmap to analyze unusual SoCs of your battery units and see deviations immediately.
Heatmap specifications:
-
Data points: Batteries > SoC/State of charge
B_SOC -
Components: all possible, e.g. all racks within a container
-
View the heatmap in Day or Month view
.png?cb=42219ce58911f46f7ca3ac8fd42717b1)
SoH/State of health distribution
Required data points:
-
SoH/State of health
B_SOH
Monitoring options:
-
chart Set up a User-defined heatmap to analyze health distribution across all battery units to detect uneven aging early.
FCE/Fully cycle equivalent
Required data points:
-
FCE/Fully cycle equivalent. See FCE/Full cycle equivalent KPI for battery units.
Monitoring options:
-
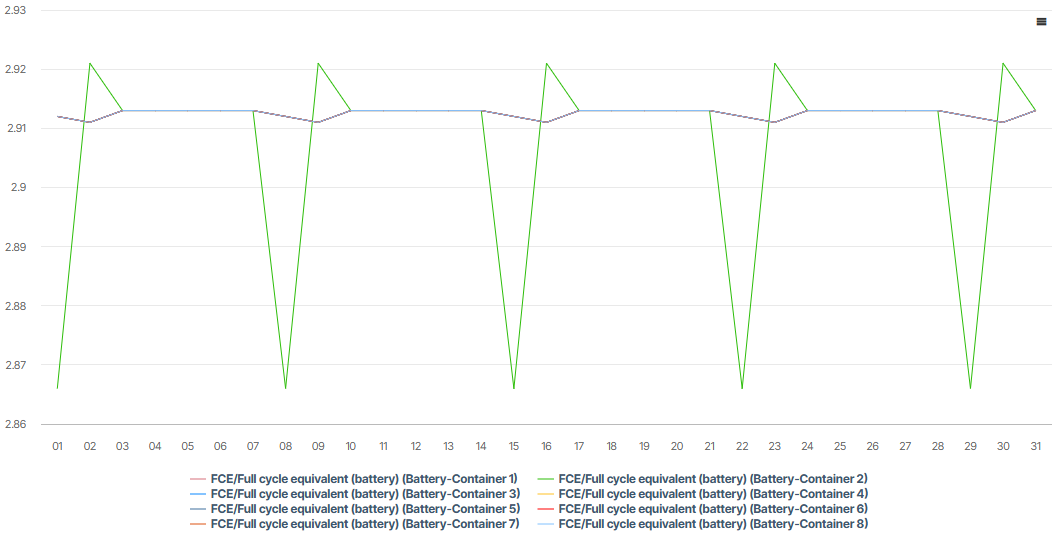
chart Set up a User-defined chart to monitor battery usage over time and compare battery utilization across battery units.
Chart specifications:
-
Data points: KPIs> FCE/Fully cycle equivalent
-
Components: all battery units
-
View the chart as of Day view
Availability (battery)
Required data points:
-
Availability (battery). See Availability KPI for battery units.
Monitoring options:
-
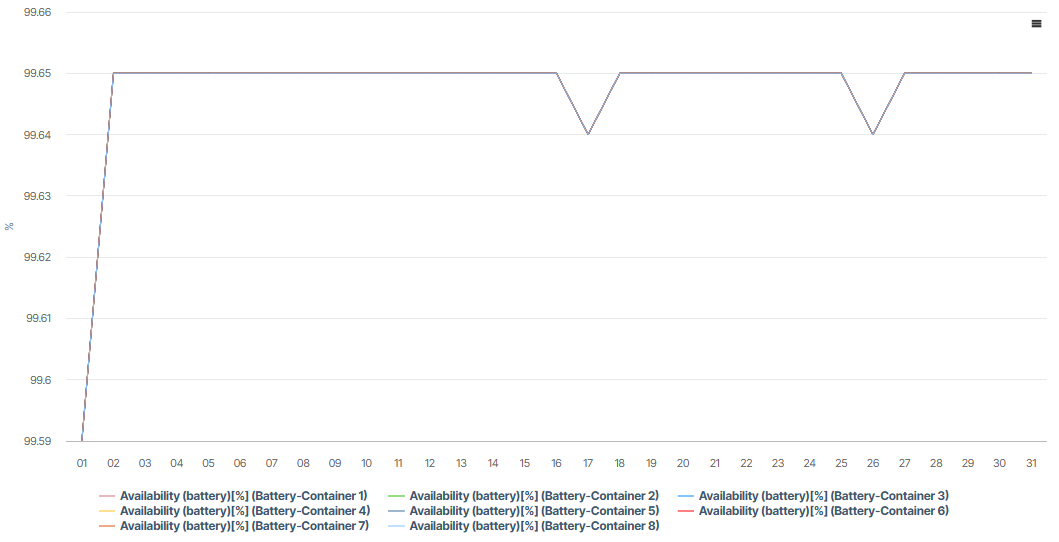
chart Set up a User-defined chart to analyze the battery units' availability.
Chart specifications:
-
Data points:
-
KPIs > Availability (battery)
-
-
Components: all battery units
-
View the chart as of Day view.
Further examples of use
Peak shaving
Required data points:
-
SoC/State of charge (PPC)
PPC_BAT_SOC_ABS -
Sum of PV inverter active power (PPC)
PPC_PV_P_AC_INV -
Power (meter) [M_AC_P]
Monitoring options:
-
chart Set up a User-defined chart to analyze how the battery charges and discharges to limit grid power peaks.
Chart specifications:
-
Data points:
-
PPC > SoC/State of charge
PPC_BAT_SOC_ABS -
PPC > Sum of inverter active power
PPC_PV_P_AC_INV -
Meter > Power
M_AC_P
-
-
Components: all batteries
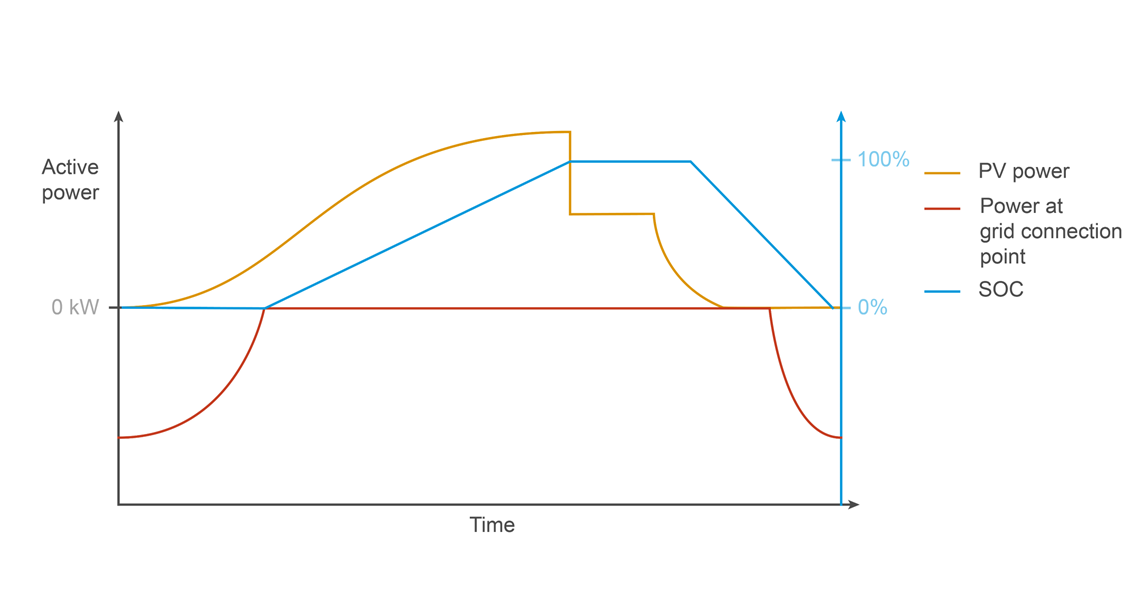
Zero feed-in/Band shaving
Required data points:
-
Sum of PCS active power (PPC)
PPC_BAT_P_AC_INV -
Power (meter)
M_AC_P -
Create a new term for load (meter value preferred if available). See Terms.
-
Create a new term for the discharging threshold. See Terms.
Monitoring options:
-
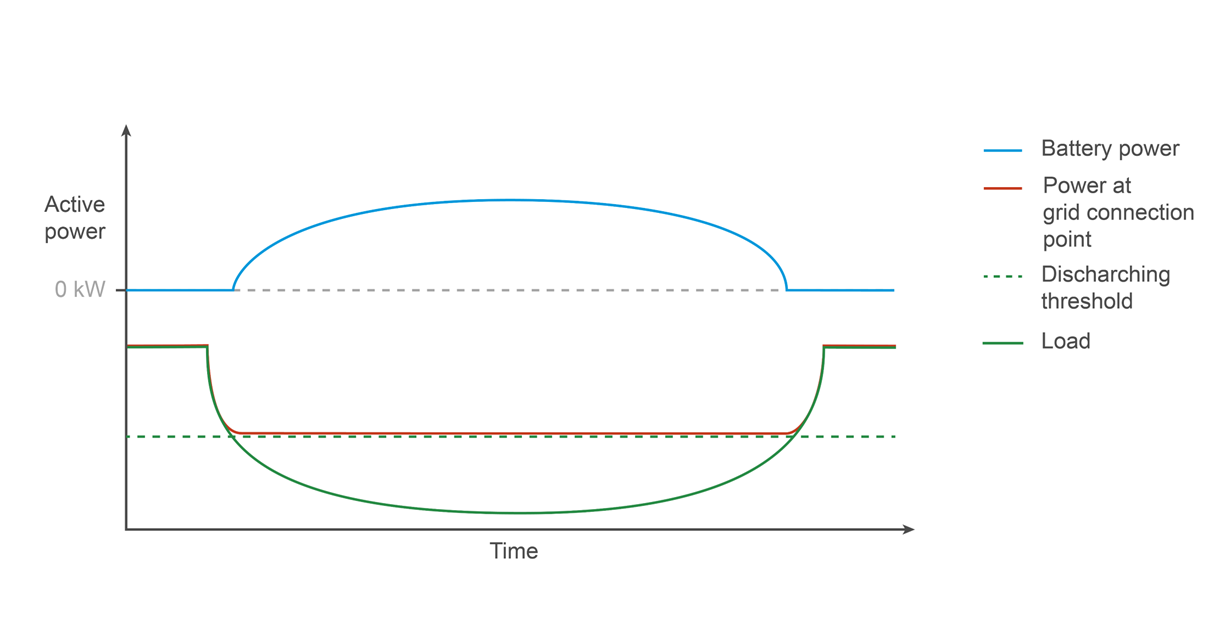
chart Set up a User-defined chart analyze band shaving with zero feed‑in by visualizing the sum of battery PCS active power alongside feed‑in meter power and load demand, highlighting how the battery discharges below a defined threshold to limit peaks and prevent grid export.
Chart specifications:
-
Data points:
-
PPC > Sum of PCS active power
PPC_PV_P_AC_INV -
Meter > Power
M_AC_P -
User-defined term for load
-
User-defined term for discharging threshold
-
-
Components: all batteries