.svg)
Last modified:
You can configure the following parameters when creating or editing a user-defined heatmap. See Create a new user-defined chart.
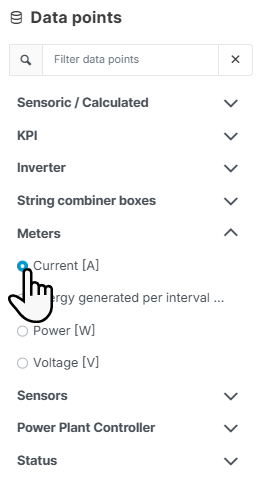

Data points
-

-

-


-
Find your user-defined terms in the category Sensoric/Calculated. The names of user-defined terms are not translated into multiple languages.
-
The selected data points is immediately added to the
.png?cb=12102cf9ad8b8bc5c973d4c89009819a)
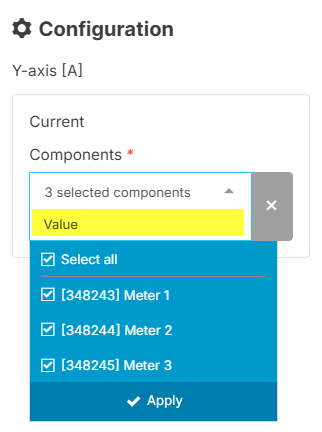
Configuration
-
You must select the system’s Components you want to be displayed in the chart, for example, a certain meter. You can search components by entering a search term when opening the components dropdown.
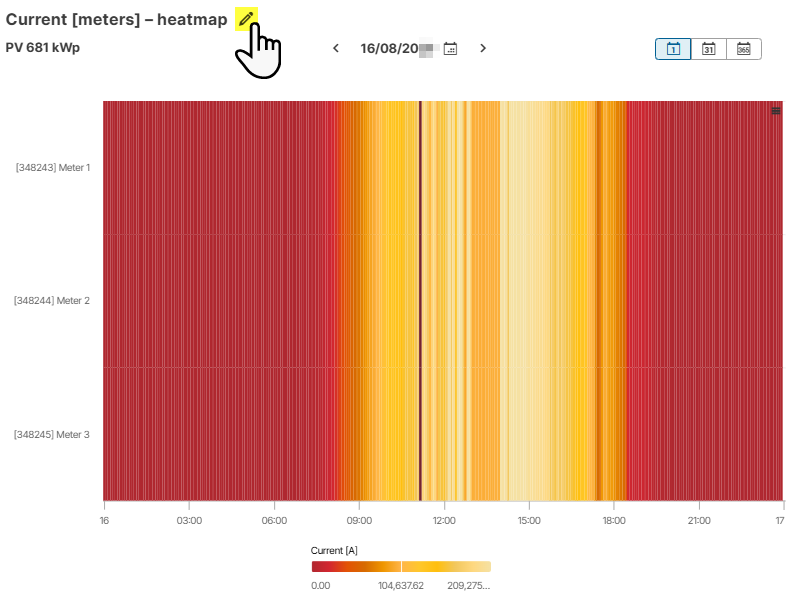
Preview
-
Select

-
Select the type of period (Day, Month, Year). In the System diagram portlet, the chart is displayed in the selected period. When selected in the Evaluation tab, the heatmap is initially displayed in the period of the previously displayed heatmap.