.svg)
Last modified:
There are several ways you can create a user-defined chart:
-
Create a chart directly in the respective system: This is the standard way to create a single chart for a specific system.
-
Create a chart from portfolio level for a certain system: This is useful if you want to create several charts for different systems and do not want to switch between systems all the time.
-
Create a chart by copying an existing chart: Use this way if you already set up a user-defined chart for a certain system and want to visualize the same data points for other systems.
Create a user-defined chart from system level
Prerequisites
-
User group customer or higher
Steps
-
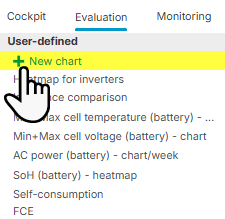
At System level , navigate to the

-
Select

-
In the appearing window, select the chart type you want to create:
-
Standard Chart: Visualize data as line, area, column, or point chart. Ideal for comparison, trends, and distribution.
-
Heatmap: Visualize data intensity as color gradients, making it easy to identify patterns and trends.
-
-
Select + Create.
-
Configure the chart type you selected in step 3:
-
Standard Chart: See Configure a user-defined standard chart.
-
Heatmap: See Configure a user-defined heatmap.
-
-
Select

The new chart now appears at the following places:
-
At SYSTEM LEVEL , in the Evaluation tab, in the section User-defined. It visible to every user who can access the respective system. Select it there to display it in full size.
-
At PORTFOLIO LEVEL , under to
.png?cb=12102cf9ad8b8bc5c973d4c89009819a)

Create a user-defined chart from portfolio level
Prerequisites
-
User group technician or higher
Steps
-
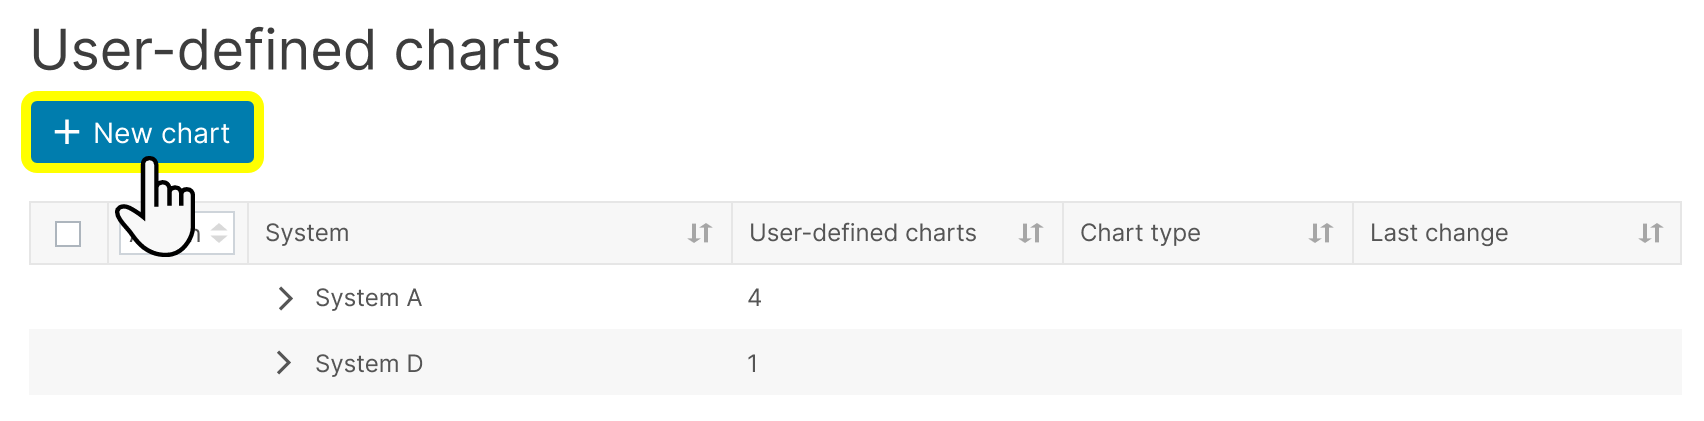
At portfolio level , go to
-
Select + New chart.
-
In the appearing window, select the following:
-
Under For the system: Select the target system for which you want to create the chart.
-
Under With the chart type: Select the chart type you want to create:
-
Standard Chart: Visualize data as line, area, column, or point chart. Ideal for comparison, trends, and distribution.
-
Heatmap: Visualize data intensity as color gradients, making it easy to identify patterns and trends.
-
-
-
Select + Create.
-
Configure the chart type you selected in step 3:
-
Standard Chart: See Configure a user-defined standard chart.
-
Heatmap: See Configure a user-defined heatmap.
-
-
Select
The new chart now appears at the following places:
-
At SYSTEM LEVEL , in the Evaluation tab, in the section User-defined. It visible to every user who can access the respective system. Select it there to display it in full size.
-
At PORTFOLIO LEVEL , under to
Copy a user-defined chart to another system
Prerequisites
-
User group technician or higher
-
At least one data point of the original chart must also be available in the target system for the chart to be copied at all. See Available data points and categories.
Steps
-
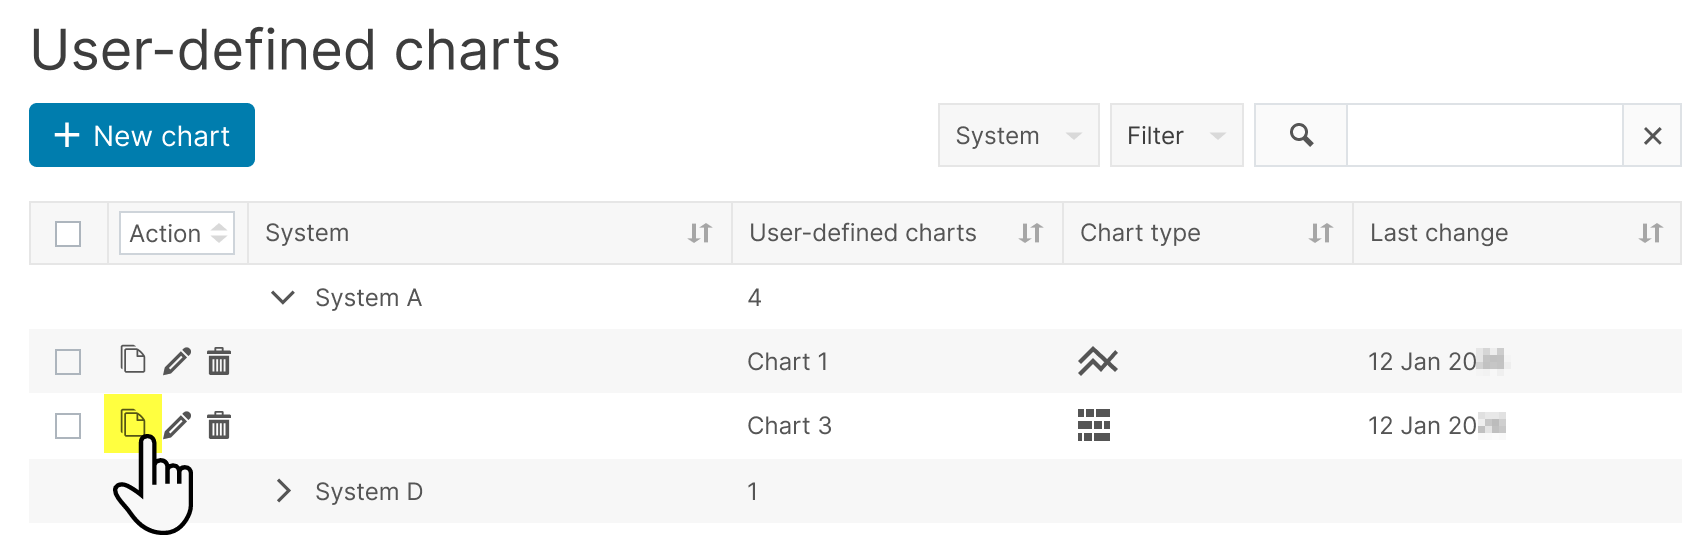
At portfolio level , go to
-

-
Select

-
In the appearing window, under System, select the target system to which you want to copy the chart to.
-
Select

-
The portal checks for matching data points in both the original chart and the target system. Matching and missing data points are displayed.
Note
Only the original chart’s data points that are also available in the target system will be included in the copied chart.
-
Select
-
For each data point, select the Components of the target system you want to be displayed in the chart.
-
Select
-
If desired, change the name of the chart for the new system.
-
Select
The new chart now appears at the following places:
-
At SYSTEM LEVEL , in the Evaluation tab, in the section User-defined. It visible to every user who can access the respective system. Select it there to display it in full size.
-
At PORTFOLIO LEVEL , under to