Last modified:
In addition to the portal’s default Battery tab at system level , you can also create your own tabs and add the portlets you need to form meaningful battery dashboards.
This page lists examples for user-defined battery dashboards with different scopes:
-
Battery safety
-
Battery performance and availability
-
Battery trends
-
You have created the user-defined charts that are required for the respective dashboard. See user-defined charts listed below and also see User-defined battery charts and alarms.
-
You have created an empty tab for each dashboard at system level. See Create a tab at system level.
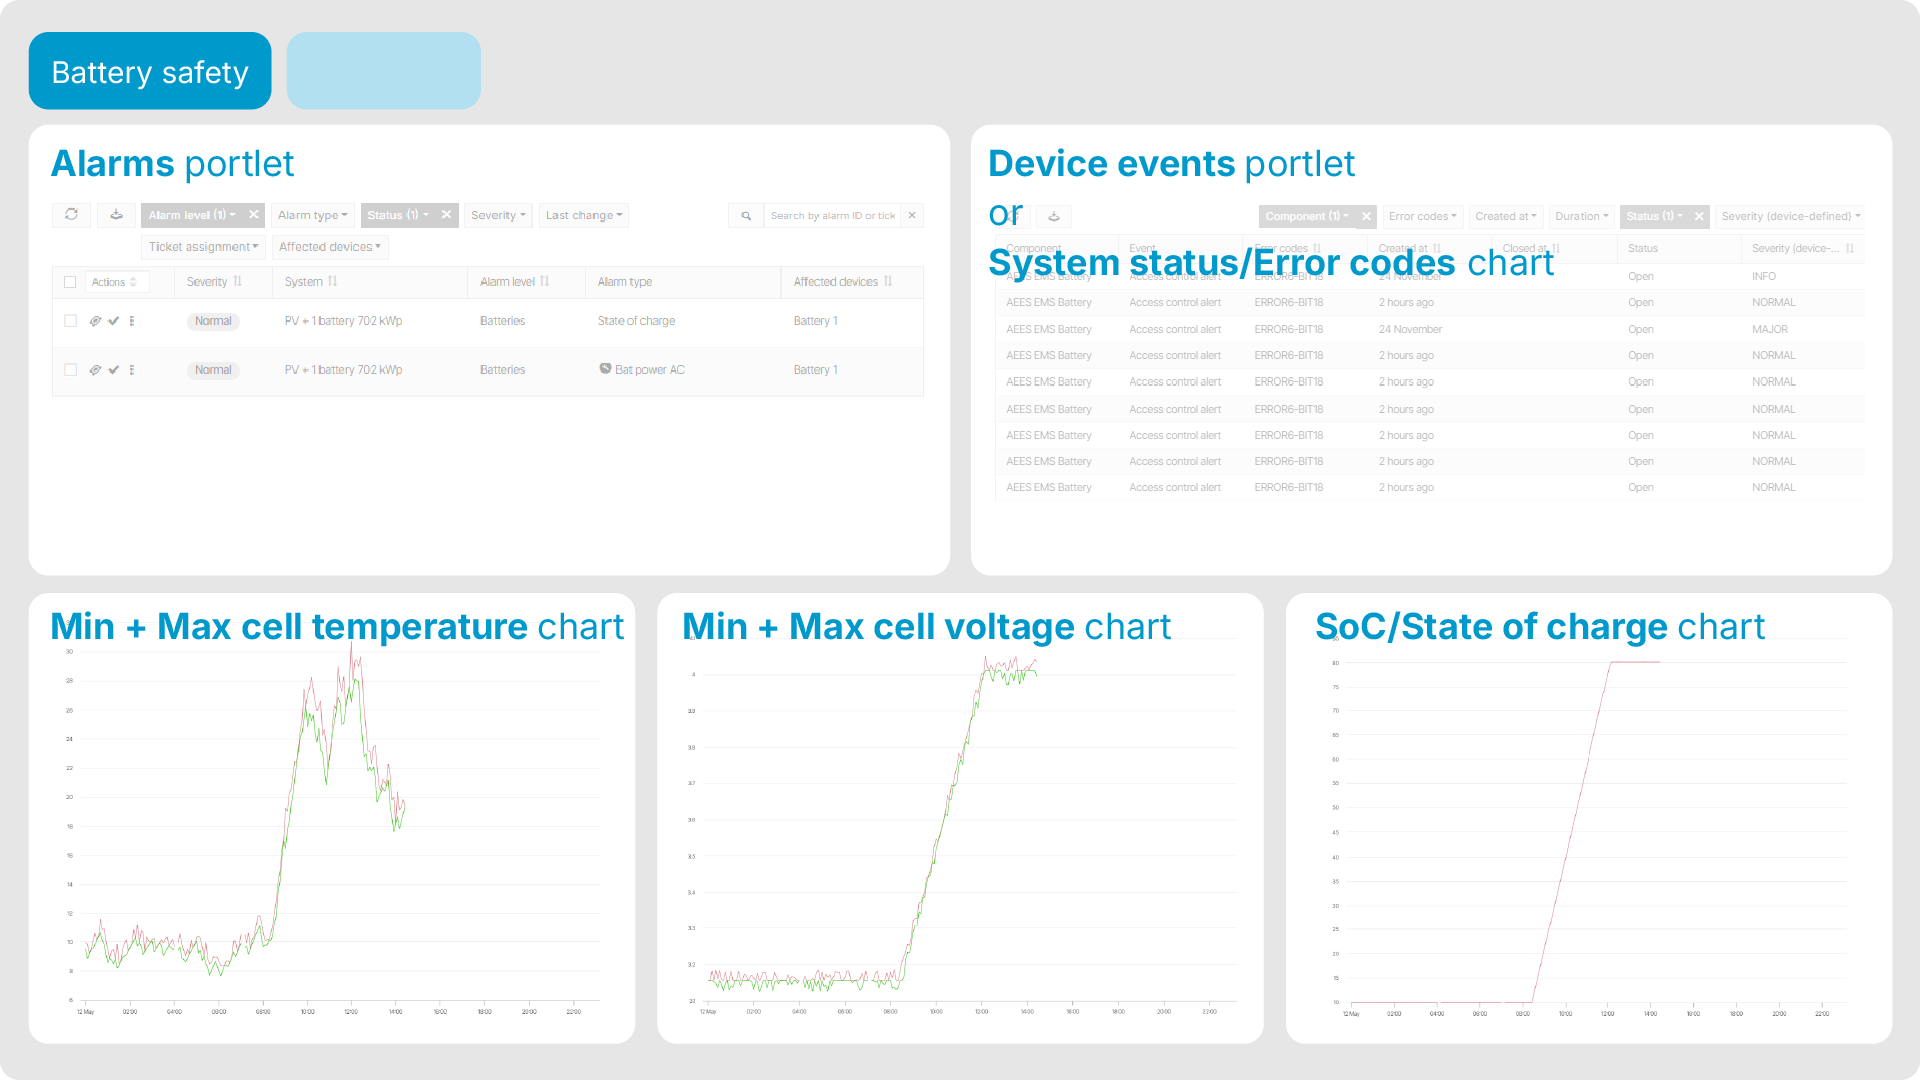
Battery safety
This dashboard focuses on safe battery operation through early detection of critical events and alarms. Add the following portlets to the tab:
-
Alarms portlet with the following filters:
-
Alarm level: Batteries
-
Status: Open
-
Sorted by Severity
-
-
Portlet for status and error codes:
-
blue'log users only Device events portlet with the following filters:
-
Component: Battery
-
Status: Open
-
-
non-blue'log users System diagram portlet set to display a user-defined chart showing battery status and error codes, see System status and error codes chart.
-
-
Three times the System diagram portlet, set to display:
-
the standard chart Battery storage > State of charge in day view,
-
a user-defined chart showing min and max cell temperature in day view, see Cell's min and max temperature chart,
-
a user-defined chart showing min and max cell voltage in day view, see Cell's min and max voltage chart.
-
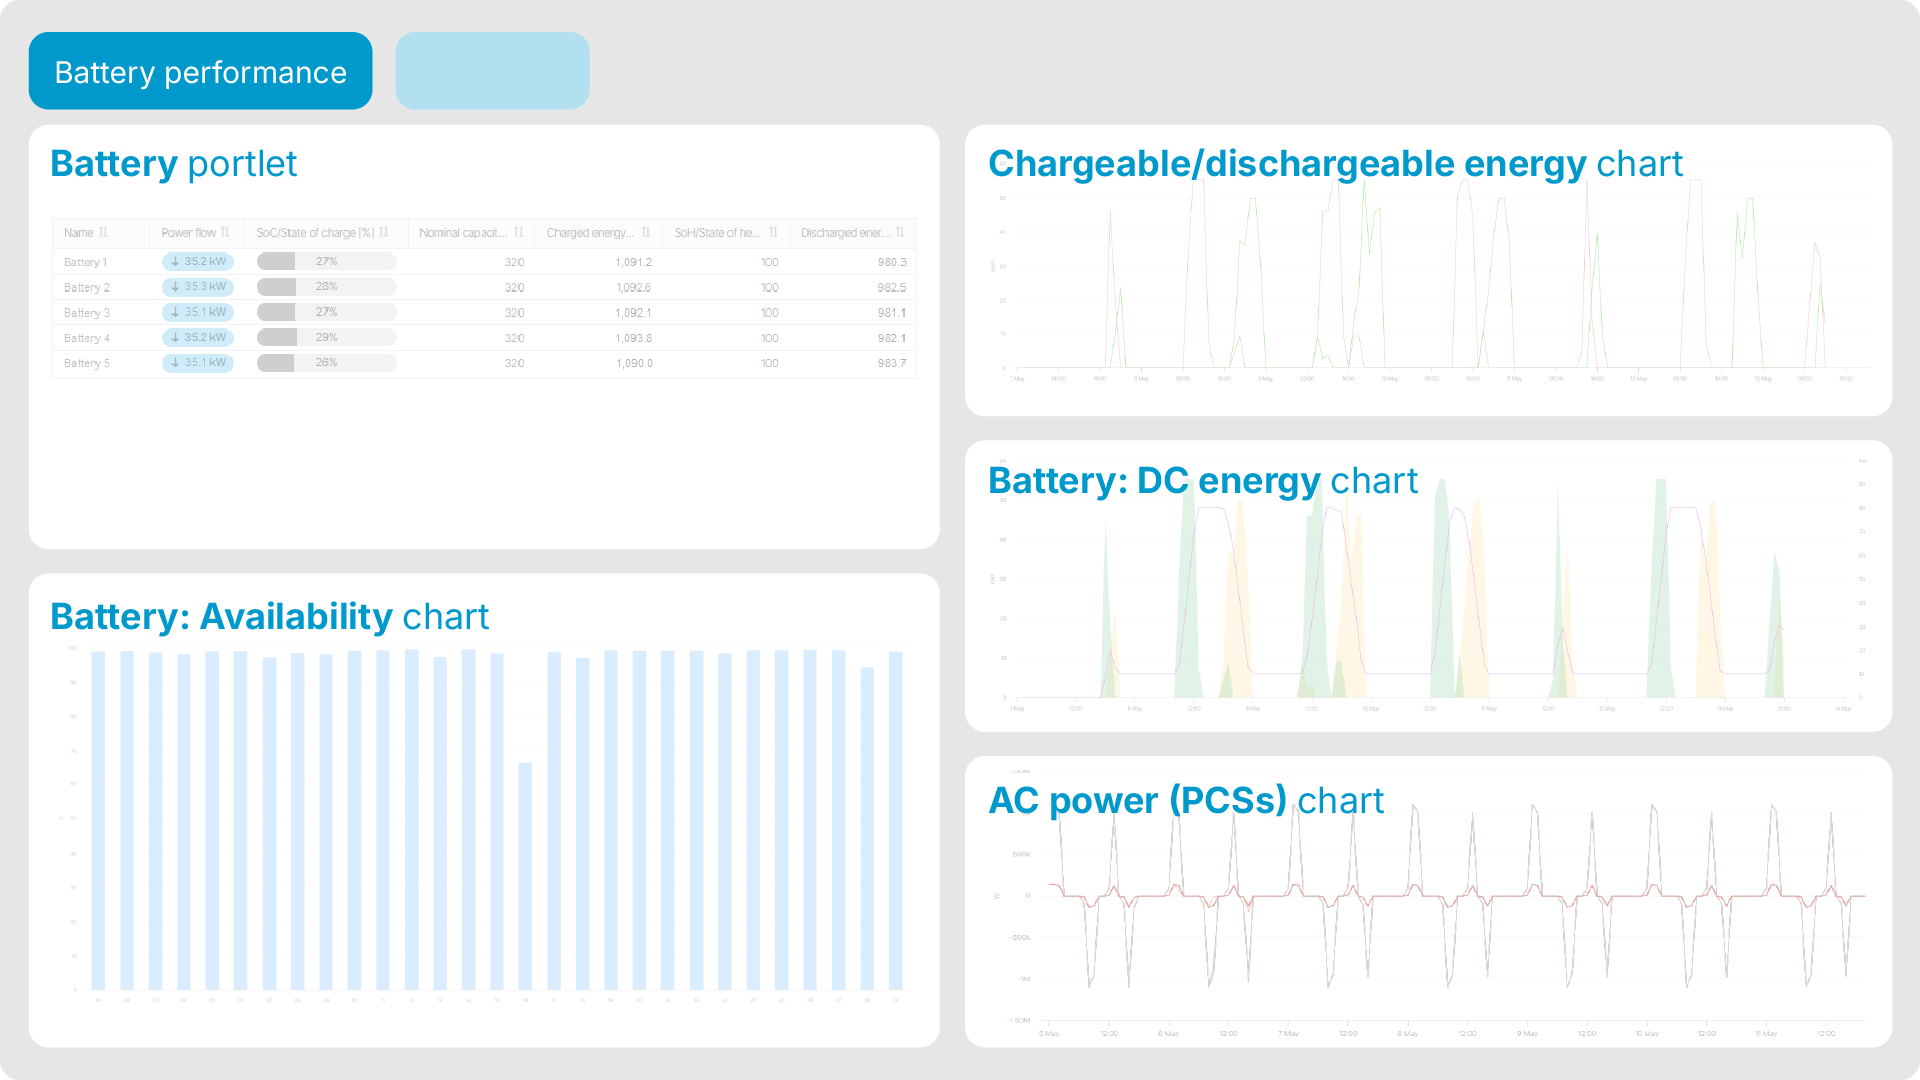
Battery performance and availability
This dashboard focuses on the batteries’ energy performance and availability. Add the following portlets to the tab:
-
Battery portlet in table view.
-
Four times the System diagram portlet, set to display:
-
the standard chart Battery storage > Availability in month view,
-
the standard chart Battery storage > DC energy in week view,
-
a user-defined chart showing chargeable and dischargeable energy per battery container in week view. See Usable energy chart.
-
a user-defined chart showing the PCSs' AC power.
-
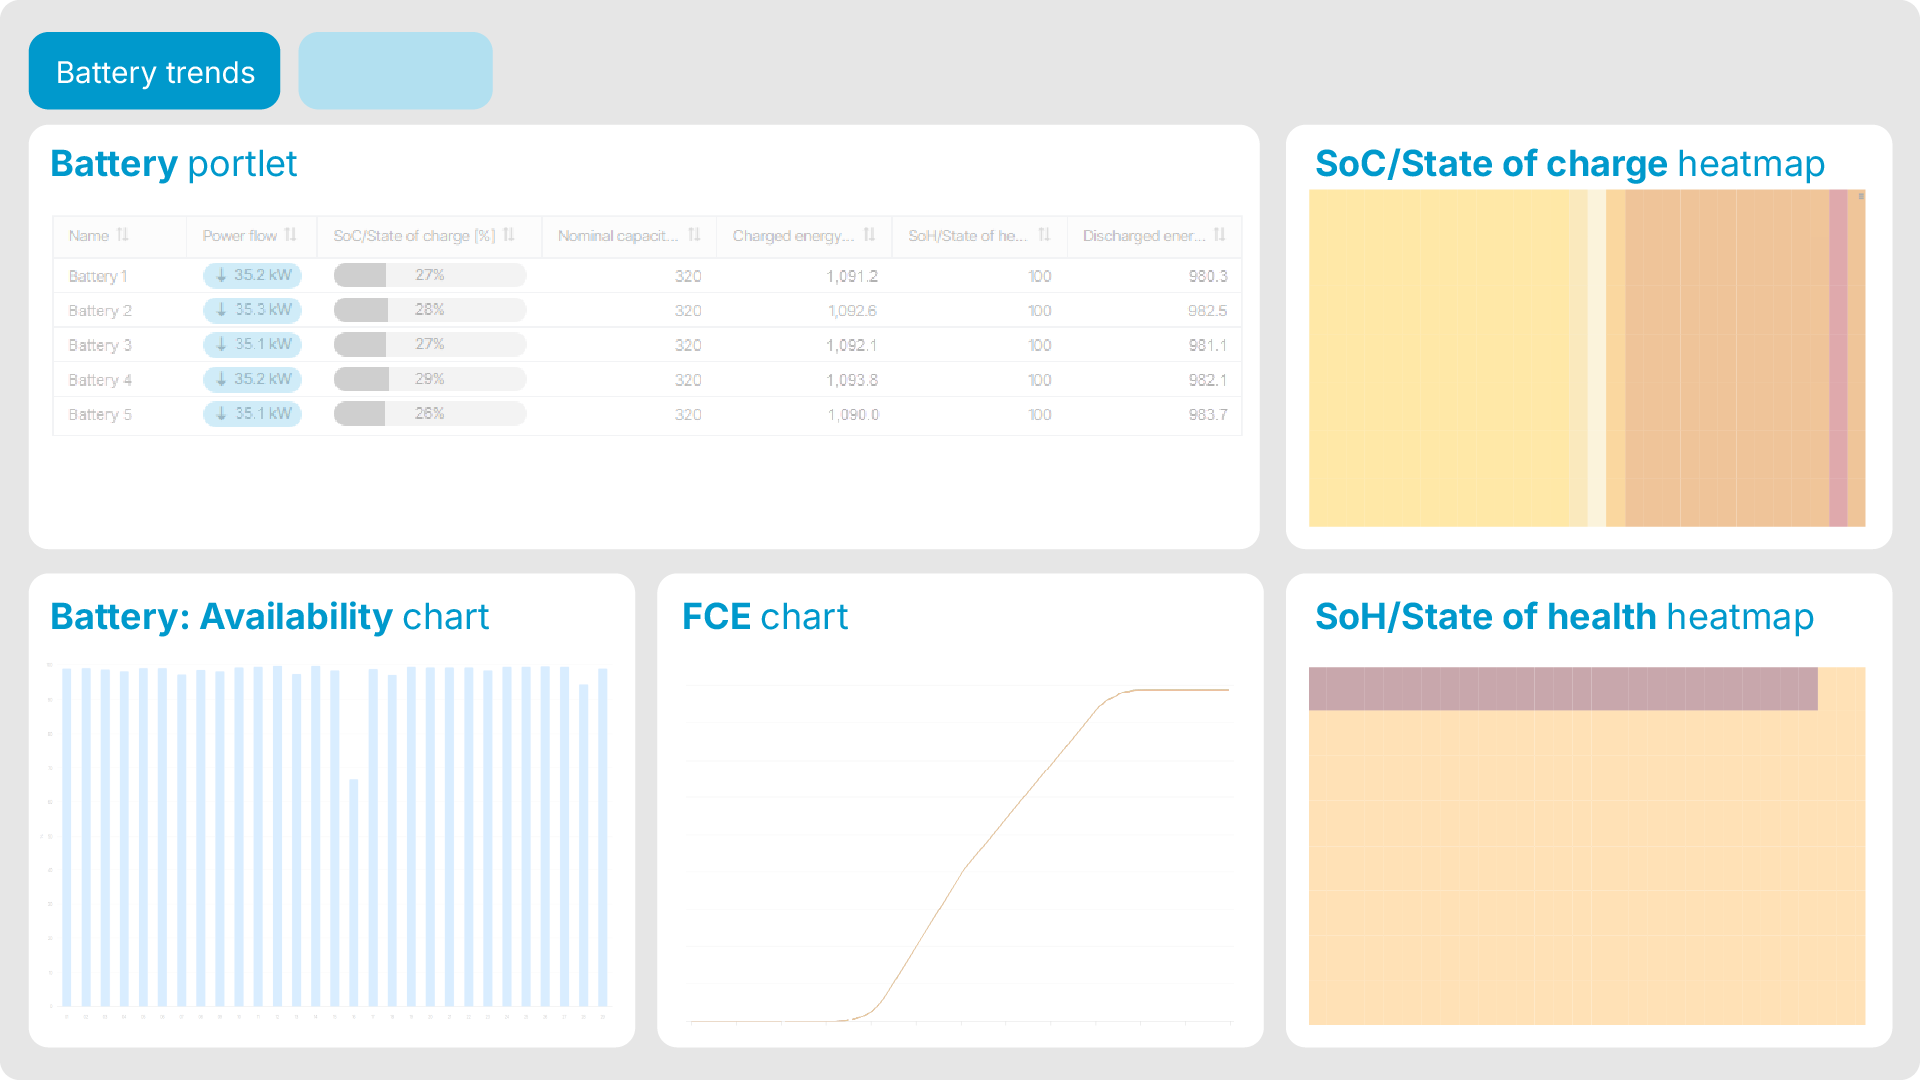
Battery trends
This dashboard focuses on the battery usage, health, and aging to support efficient operation. Add the following portlets to the tab:
-
Battery portlet in table view.
-
Four times the System diagram portlet, set to display:
-
the standard chart Battery storage > Availability in month view,
-
a user-defined chart showing the Full cycle equivalent count per container in month view,
-
a user-defined heatmap showing SoC/State of charge per container in month view. See SoC heatmap,
-
a user-defined heatmap showing SoH/State of health per container in month view.
-