Last modified:
You can view the realtime data of the devices connected to your bluelog. Realtime values are a live measurement: the data is neither stored nor exported and is only displayed on the web interface.
View realtime values
Prerequisites
-
At least one device is installed on your bluelog.
Steps
-
Go to Cockpit > Realtime values.
-
Under Value selection, select the device type(s) you want to display.
-
The active device category is underlined in blue.
-
-
Select the devices you want to display. Select all to select all devices of a category.
-
Example: “Inverters 1/2” means that two inverters are configured, and you have selected one to display.
-
-
Under Values, select the values you want to display. The Select all option allows you to select all values of a category.
-
Select View.
The realtime values are listed under Realtime values and can be displayed in the Charts.
Note
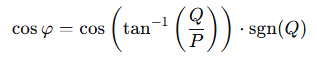
Cos phi (also known as cos φ or power factor) is a calculated value.
When multiple real meters are combined into a virtual meter, the cos phi value is calculated based on the following formula:
Variables
-
P is the measured active power sum of all phases
-
Q is the measured reactive power sum of all phases
-
tan-1 represents the arctangent function
-
sgn(Q) represents the sign of Q, so if Q is underexcited it is -1, otherwise it is 1
Any measured values from the individual meters are ignored.
Check communication between bluelog and another device
You can check how well communication is working between the bluelog and a device using the Telegrams received and Telegrams transmitted checkboxes under Values. The transmitted and received telegram counts should match, confirming that commands are successfully sent and acknowledged. A mismatch may signal a device issue or require adjustments to the read delay or timeout settings.
Prerequisites
-
At least one device is installed on your bluelog.
-
The device is connected via RS485 or Ethernet.
Steps
-
Go to Cockpit > Charts (to display information as a chart) or Cockpit > Realtime values (to display information in a list).
-
If multiple devices are installed, select the relevant device category (e.g., Inverters). You can view multiple categories at once.
-
Select the device(s) by ticking the checkboxes, or choose Select all to include all devices in a category.
-
Tick Telegrams received and Telegrams transmitted under Values.
-
You can view the telegrams in the Chart area. To view the telegrams in the Realtime values area, select View.
-
If the transmitted and received telegram counts do not match, indicating a potential issue, contact Support for assistance.