Last modified:
Get an overview of a specific asset and its performance with the help of various widgets.
Dashboards
Dashboards are made up of widgets that give you different overviews of your assets. Depending on your needs, you can have different dashboards for each asset, or apply the same dashboard to all of your assets. Whether a widget shows aggregated data of any sub-assets is defined in the respective dashboard template.
Note
Data of production assets in conceptual stage is not included into evaluations on your dashboards and widgets. See Conceptual stage for production assets.
Choose a dashboard
-
Enter the dashboard in platform view, by selecting the dedicated domain tab for

-
Select the dashboard you want to display from the dropdown. There is a Default Dashboard in mc Assetpilot. For customized dashboards, you must first create dashboard templates, see Dashboard templates.
-
Select a pre-defined or custom period for which data should be displayed from the second dropdown.
The widgets on the dashboard will now display data for the selected period.
Example
See below the custom dashboard System overview for the period This year.
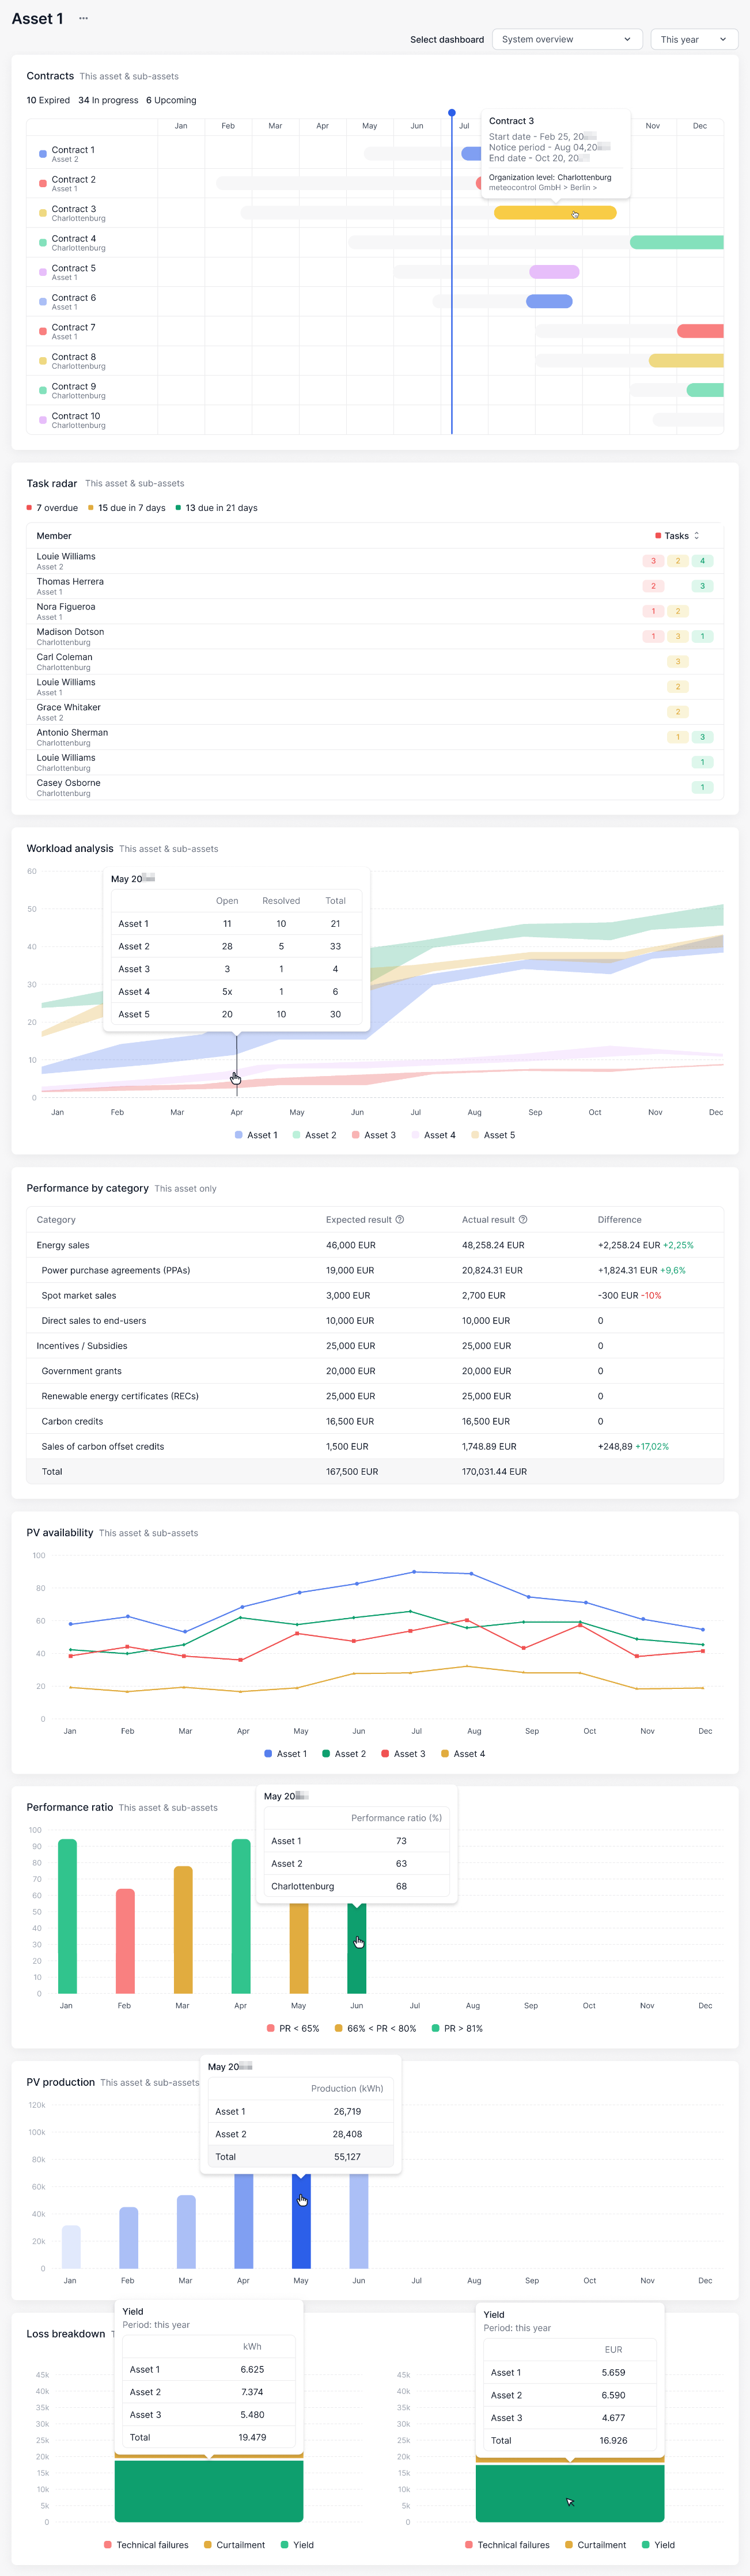
Types of dashboard widgets
The available dashboard widgets are briefly described below.
Consolidated financial performance
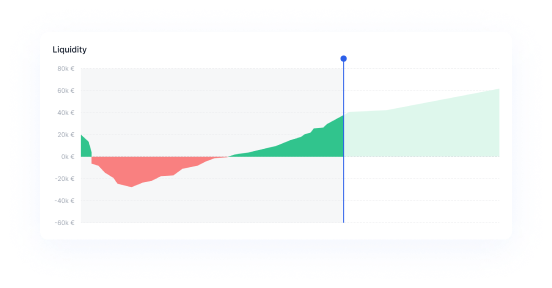
Compare your financial forecasts for an asset with its actual cashflows and display the liquidity of this asset. Cashflow and forecast should ideally be displayed as a continuous line. The gap between these represents the cash that is missing.
Workload analysis
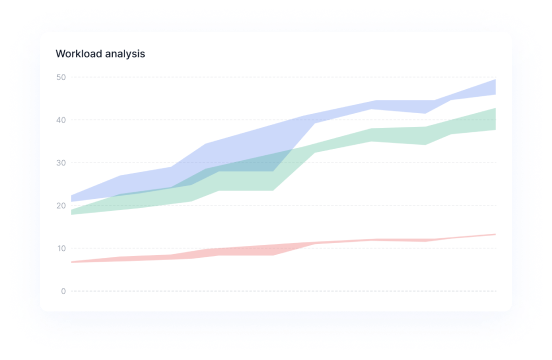
Identify bottlenecks and inefficiencies in task management. As you continuously complete tasks and add new ones, it's essential to gauge your efficiency. This widget enables you to compare the number of tasks created versus tasks completed, providing insights into your efficiency. The blue line rises as tasks are added, while the green line rises as tasks are solved. A significant gap between the lines suggests a that your workload is too high. You may need to make adjustments to your schedule, such as allocating more time to specific tasks or modifying deadlines.
Contract notice periods
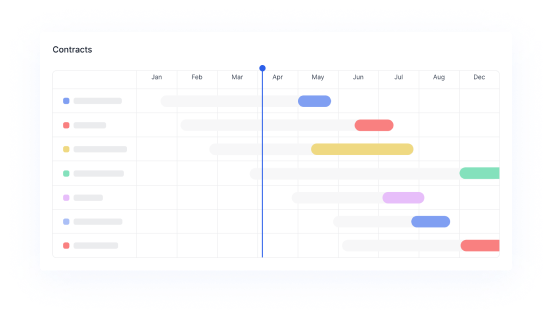
View your top 10 contracts with the nearest notice periods in the selected period. When you are managing numerous assets and their respective contracts, it is essential to keep track of the details so you do not miss any deadlines.
PV production
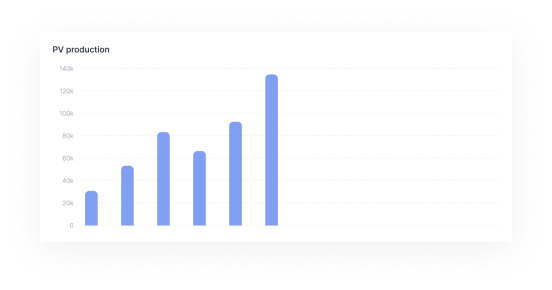
View the energy generated by your PV assets.
This widget requires synchronization with VCOM. See VCOM syncs.
Topic
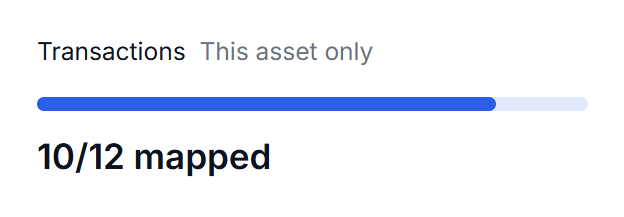
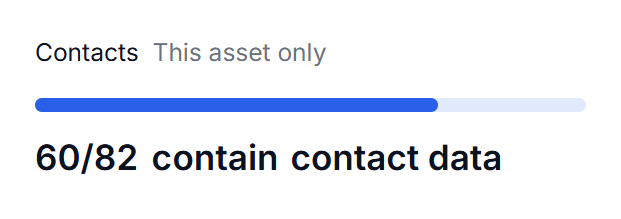
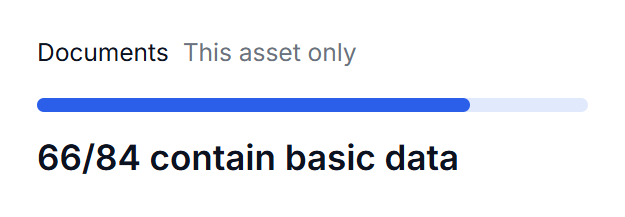
Check for unmapped transactions or check the number of unfilled input fields for your documents or contracts.
Monthly cashflows
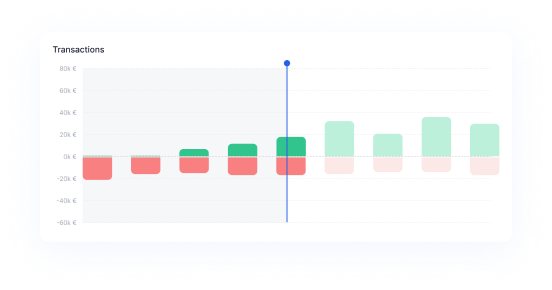
View an asset’s monthly cashflows as a bar graph based on your cashflow input.
Task radar
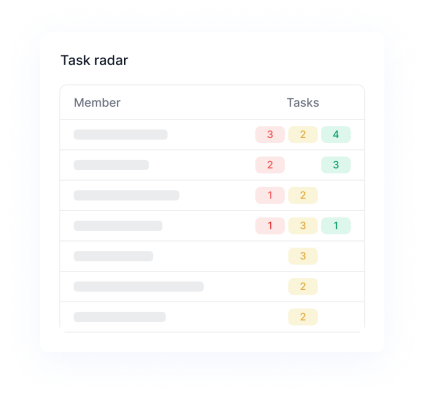
Keep tabs on upcoming task deadlines, urgency, and responsibilities.
Profit/Loss overview
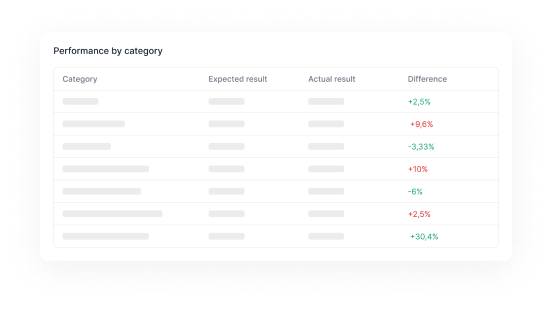
Compare forecasted and actual results of entire categories. This way, you will have the financial performance overview for each category (subcategories included). Categories with no forecasted or mapped transactional data will not be shown in the widget.
Also view in-between results for earnings before interests, taxes, depreciation, and amortisation (EBITDA), earnings before interests and taxes (EBIT), and earnings before taxes (EBT).
Performance ratio
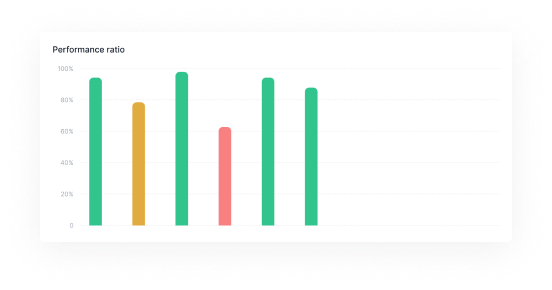
View the average performance ratio of your asset in percent.
This widget requires synchronization with VCOM to evaluate energy production. See VCOM syncs.
PV availability
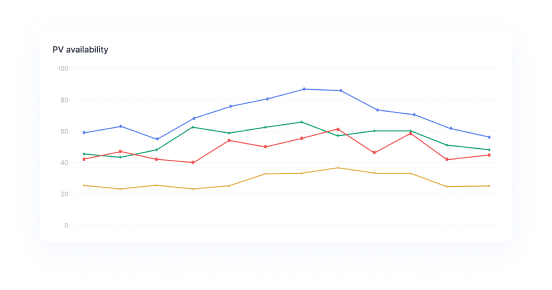
View the percentage of time your asset generated energy.
This widget requires synchronization with VCOM to evaluate energy production. See VCOM syncs.
Loss breakdown
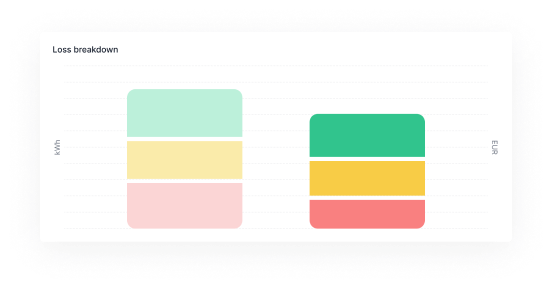
View the energy and revenue losses of your asset.
This widget requires synchronization with VCOM to evaluate energy production. See VCOM syncs.
Logbook
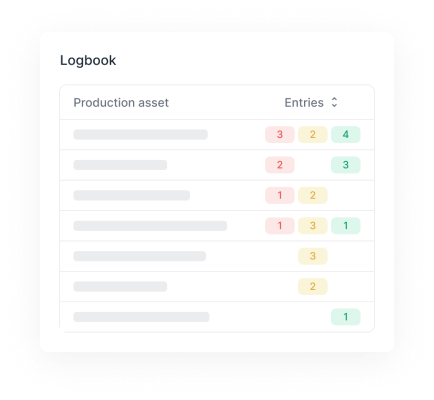
Log special events to track unusual behavior of your assets. See Logbook.
Work orders
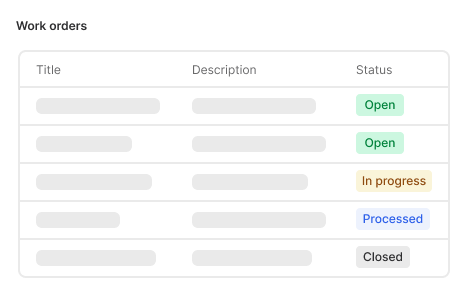
Display all work orders available for your asset.
This widget requires synchronization with VCOM. See VCOM syncs.