KPI editor for PR and system availability
Last modified:
About the KPI Editor
O&M contracts commonly require a system availability or performance ratio (PR) guarantee. Different companies may use different measured values to calculate this. It is therefore essential for O&Ms and investors to share a common understanding of how these KPIs are calculated. Once defined properly, KPIs enhance communication by providing clear and easily interpretable metrics.
The KPI Editor is a license-based VCOM module that allows you to:
Define the PR and system availability with standardized formulas
Select the measured values used for the calculations
Tailor the calculation to specific systems and data requirements
It is included for premium partners or can be purchased as an additional module. Contact Sales for more information.
Note
If no PR or system availability calculation is available, this could be due to missing data, an outage, or low irradiance. Check your data sources and alarms.
To help identify root causes, you can ![]() download a CSV file to view the raw data used for the PR calculation (daily aggregation). The same root causes will affect system availability as well.
download a CSV file to view the raw data used for the PR calculation (daily aggregation). The same root causes will affect system availability as well.
KPI Editor and ticket exclusion
Settings in the KPI Editor affect the ticket system and charts.
You can exclude intervals from the PR and system availability calculations by means of a ticket. This ensures that outages outside your contractual responsibilities do not lower your PR or system availability.
Example 1: An inverter was broken from February 21-22 and was not delivering values. A ticket was created for this, and you can now exclude this ticket cause.
Example 2: If a grid downtime on April 2 from 12:00-14:00 was documented in a ticket, you can exclude this ticket cause.
When an interval is excluded from the calculation, the corresponding chart will show nothing for that interval.
If a ticket that affects only one or several inverters is excluded from PR or System availability, only the affected inverters’ production is removed from system-level KPIs.
AUTOMATION Tip: To save time, use the Automation module to automatically create tickets with specific ticket causes. You can then configure the KPI Editor to always exclude these ticket causes.
Performance ratio with the KPI Editor
The performance ratio is calculated based on the system yield, installed DC power, and irradiation at the module plane. It indicates how well the PV system can convert solar energy. Typically, an annual PR value of 75-85% is considered good.
The KPI Editor allows you to:
Define different input parameters according to your needs
 Create multiple PRs
 Edit and Delete PRs
 Mark one PR as the main PR
 Export your calculation parameters and data as an Excel chart/spreadsheet
View the main PR in the Performance ratio chart
Compare the main PR with other PRs in the Performance ratio comparison chart.
Example: compare the PR stipulated in a contract with a technical PR.
Standard PR formula
The PR formula from IEC 61724-1 is used by default:
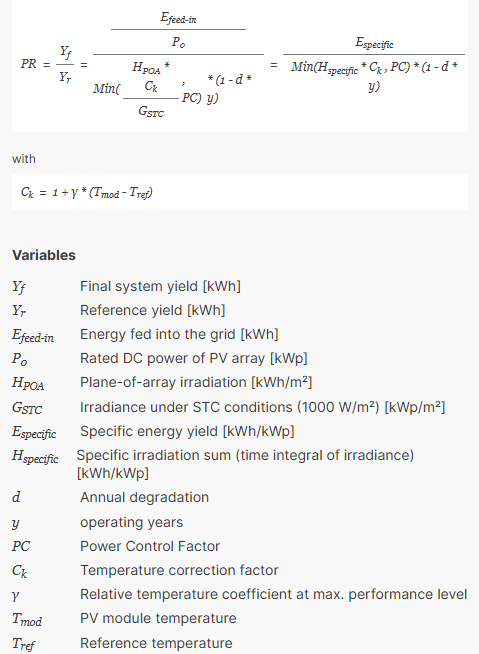
Default performance ratio formula based on IEC 61724-1
Editable PR parameters with the KPI Editor
You can edit the following PR parameters with the KPI Editor. These settings affect the Performance ratio (PR) chart and the Performance ratio comparison chart.
Parameter | Description |
|---|---|
Source of data | Energy must be defined as a term with the unit kWh. |
Source of irradiance data | One of the following must be available:
|
Scope of data | Interval during which the PR is calculated. We recommend Irradiance as threshold to exclude irrelevant intervals, as this works better on cloudier days. |
Aggregation of data | Choose how to compile your data based on your requirements and/or contractual stipulations. |
Excluded ticket causes | Choose which ticket causes should be excluded from the calculation. |
Temperature compensation | The temperature source must be defined as a term with the unit °C for module temperature. See Terms. |
Degradation | Add the annual degradation rate of your modules. This can be the same rate entered under Yield forecast, or a different rate. |
Power control | Select the source of power control/curtailment. The available values are based on one of the following:
Once selected, the value will be factored into the calculation. |
PR chart thresholds
You can define the thresholds for different performance levels (displayed as green, yellow, and red) that are reflected in the Performance ratio (PR) chart and Performance ratio comparison chart:
Portfolio-wide for every system: At the PORTFOLIO-LEVEL, go to
.png?inst-v=a90920b4-4f00-49df-b9bd-40ca74142bd7) Administration >
Administration >  Customization > Design > Chart thresholds.
System-specific for each system separately: At the SYSTEM-LEVEL, go to
 System configuration >
  Calculations > Performance Ratio > PR chart thresholds.
System availability with the KPI Editor
System availability is the percentage of a system that is available over a period of time. It is an indicator of how quickly faults are identified and remedied.
Standard system availability formula
The following system availability formula is used by default:
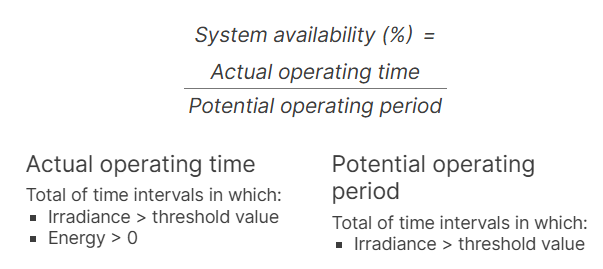
Default system availability formula
Editable PR parameters with the KPI Editor
You can edit the following system availability parameters with the KPI Editor. These settings affect the System availability chart and the Inverter availability chart.
Parameter | Description |
|---|---|
Calculation method | System level: Monitor the energy of the entire system. Inverter level: Tracks the power of every inverter. The individual values are then used to create an overall value. |
Irradiance threshold | Set the minimum irradiance value required for system operation. |
Source of irradiance data | Select whether your irradiance data comes from a Sensor or Satellite. |
Excluded ticket causes | Choose which ticket causes should be excluded from the calculation. |
Weighting by irradiance | This option gives more weight to intervals with higher irradiation levels. Instead of a simple time-averaged availability, the availability of each time interval is multiplied by the irradiance level during that period before averaging. If you select this option, the weighted values are displayed in the charts. It is also possible to recalculate the values for historical data under Terms. Weighting by irradiance is useful for comparing systems across different climatic conditions or identifying downtime issues that primarily affect high-production periods. |