Yield forecast chart
Last modified:
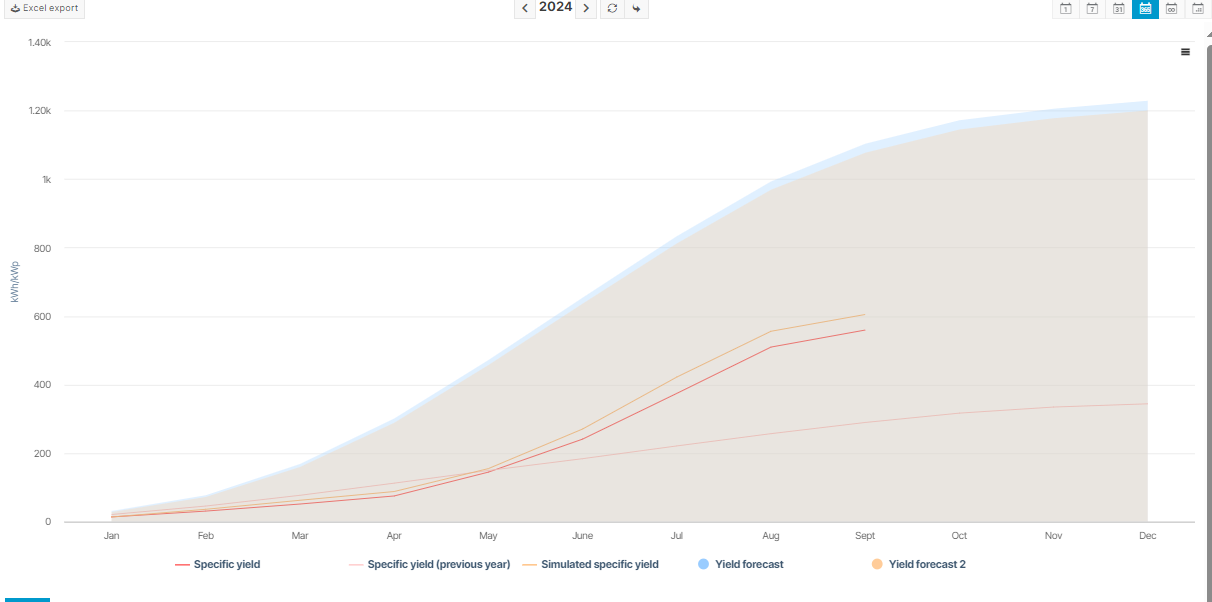
Chart
View the chart at SYSTEM LEVEL under Evaluation.
In the example, the light blue section of the chart displays the yield forecast.
Yield forecast chart
Basic info
Description | The yield forecast chart compares the system’s actual, normalized energy (= specific yield) with the normalized energy from yield forecasts. |
|---|---|
Prerequisites |
|
Further details | When configuring the yield forecast, you can:
|
Note
Find further information on the general functions within charts on Evaluations & charts.
Configure yield forecast
Prerequisites
User group Technical customer or higher
Data from at least one yield report
Steps
At SYSTEM LEVEL, navigate to
 System configuration >
  Calculations > Yield forecast.
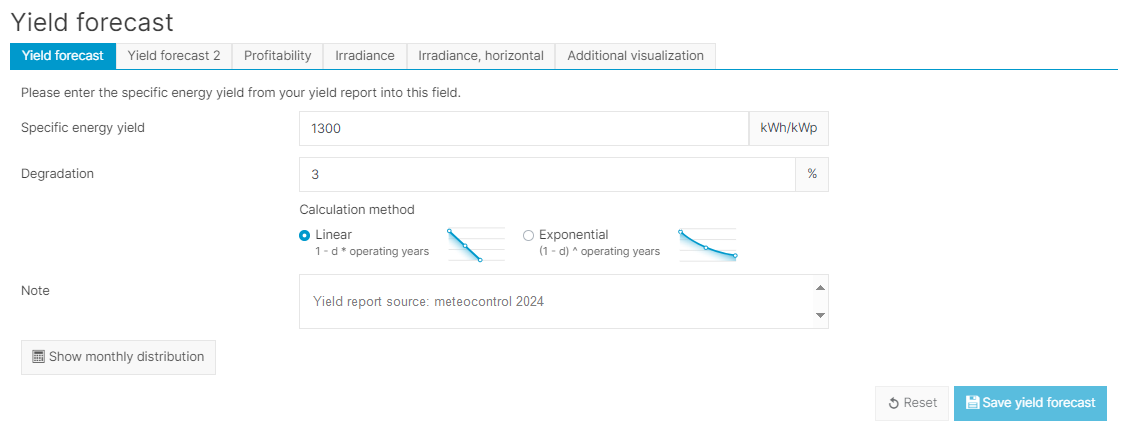
In the Yield forecast tab, enter the Specific energy yield in kWh/kWp provided in your yield report.
Enter the annual Degradation of your modules in % as specified in your yield report or manufacturer data sheet. Specify whether the degradation is linear or exponential.
Tip
Operating years start with 0 for the first 12 months (not 365 days or first year). In other words, degradation is not calculated in the first year because d=1.
Optionally, add a Note. For example, the name or source of the yield report.
Select
 Save yield forecast.
Configure yield forecast
Further actions
Once you have added the first yield forecast, you can take the following actions:
Edit data for monthly values
Based on the country where you are located and average irradiance values, VCOM will automatically calculate the average specific energy for each month. If your yield report contains more precise data, you can edit the values by selecting Monthly distribution.
Enter a second yield forecast
Enter data from a second yield report under Yield forecast 2 tab. Follow the steps under Configure yield forecast.
Prerequisite: You have completed and saved the first Yield forecast tab.
Enter profitability
Your yield report may indicate a specific energy yield that will ensure your system is profitable. If this information is available, select the Profitability tab. Follow the steps under Configure yield forecast.
Check Display as graphic to display profitability as a data point in the chart.
Enter irradiance and irradiance (horizontal)
If your yield report provides information about irradiance values, enter the information under the tabs, then follow the steps under Configure yield forecast:
Irradiance: irradiance on the module plane/plane of array irradiance (POAI)
Irradiance (horizontal): global horizontal irradiance/GHI
Visualize additional data
Note
Yield forecast and Yield forecast 1 are displayed in the Yield forecast chart.
To display the Simulated specific yield and Values of the previous year in the chart as well, select these options in the Additional visualization tab.
The following data points can only be displayed as part of in OpenOffice reports: Irradiance and Irradiance (horizontal)
Troubleshooting: error message for monthly distribution
Problem
When you manually adjust the monthly distribution of values, you get the error message Check your monthly distribution and adjust the misconfiguration.
Solution
The values for the monthly distribution must add up to the total annual value.
Example
If your annual value is 1000 Wh/m2, check that the monthly values add up to 1000.