Performance ratio (PR) chart
Last modified:
Chart
View the chart at SYSTEM LEVEL under Evaluation.
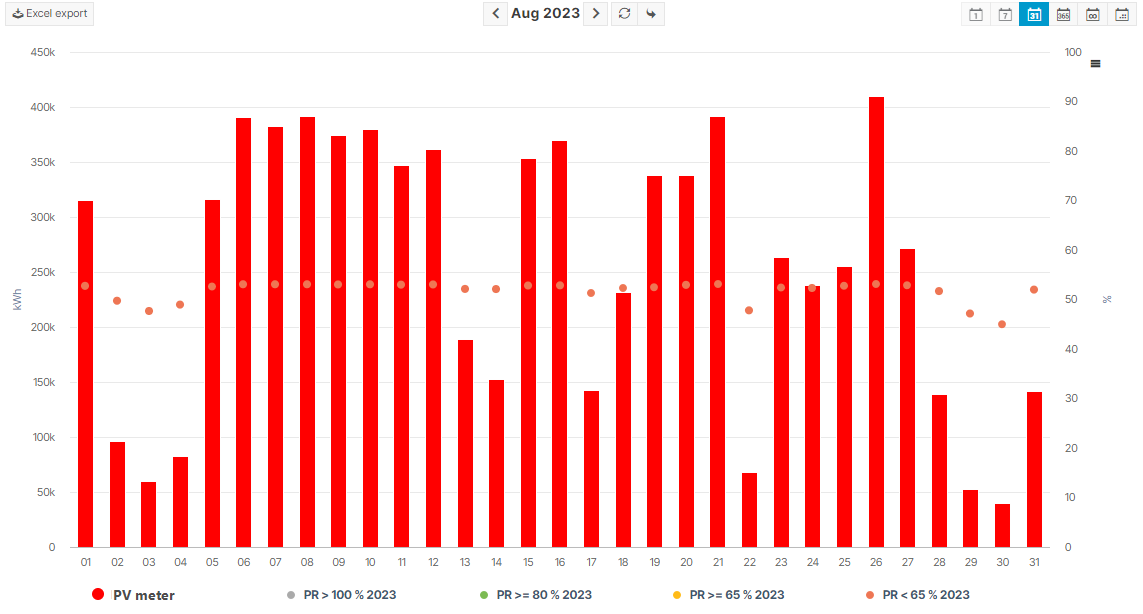
Performance ratio chart
Basic info
Description | The performance ratio is calculated based on the system yield, installed DC power, and irradiation at the module plane. It indicates how well the PV system can convert solar energy. Typically, an annual PR value of 75-85% is considered good. |
|---|---|
Prerequisites |
|
Further details | Standard formula and calculationThe PR formula from IEC 61724-1 is used by default: 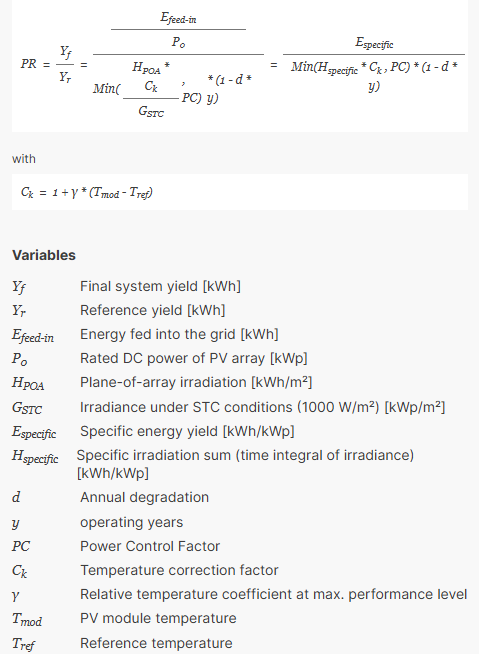 Default performance ratio formula based on IEC 61724-1
Customization with the KPI EditorNote The standard formula is displayed for basic partners. The VCOM module KPI editor for PR and system availabilityallows you to adapt the input parameters to your needs.
|
Caution
If your site has multiple power plant controllers (blue’Log XC data loggers or third-party PPCs), each controller should be configured as a separate system, not as a subsystem. Otherwise, the performance ratio will not be calculated.
Example: A site has PV production across three rooftops, each with its own PPC. In this case, configure each rooftop in VCOM as a separate system.
To view the overall PR for the entire site, you can combine these individual systems into a virtual system in VCOM.
If you require further assistance, contact Support.
Note
Find further information on the general functions within charts on Evaluations & charts.