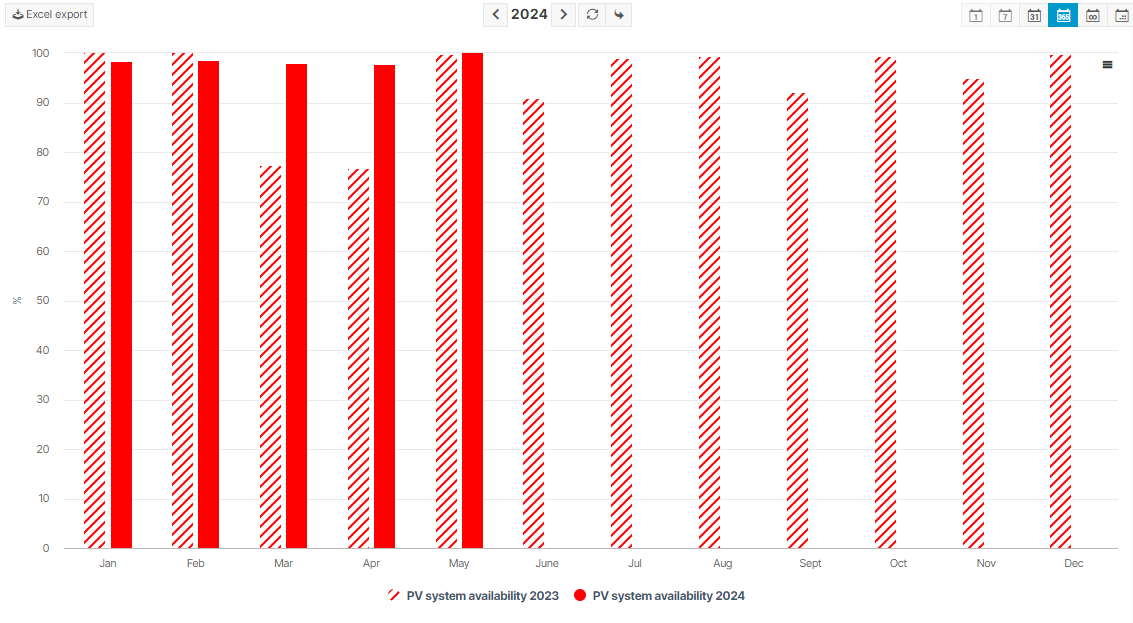
System availability
Chart

Basic info
Description | System availability is the percentage of a system that is available over a period of time. It is an indicator of how quickly faults are identified and remedied. |
|---|---|
Prerequisites |
|
Further details | Standard formula and calculation
Note If you wish to define the input parameters differently, see KPI editor for PR and system availability.   |
Sample calculation
Interval | Irradiance (W/m2) | Energy (kWh) | Result |
|---|---|---|---|
I1 | 90 | 10 | Not rated |
I2 | 125 | 20 | 100% |
I3 | 200 | 30 | 100% |
I4 | 80 | 0 | Not rated |
I5 | 250 | 0 | 0% |
I6 | 200 | NULL* | 100% |
I7 | 150 | 30 | 100% |
I8 | 130 | 20 | 100% |
I9 | 110 | 0 | 0% |
System availability | 5/(5+2) = 71.4% | ||
*NULL means no data available for this interval | |||
.png)