Self-consumption chart
Last modified:
Chart
Self-consumption chart
Details | |
|---|---|
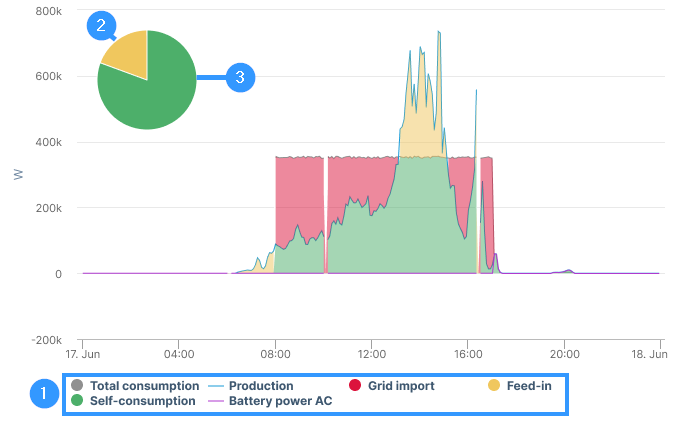
| 1 | Select the fields in the legend to activate or deactivate them in the chart |
| 2 | Percentage of grid feed-in |
| 3 | Percentage of self-consumption |
Basic info
Description | Gives an overview of energy values for systems that consume generated energy directly on-site (self-consumption). The lines show energy values. The shaded areas illustrate the portions of grid import, self-consumption, and grid feed-in. The pie chart shows the ratio of feed-in and self-consumption in relation to the total production. |
|---|---|
Prerequisites | Self-consumption term, see Self-consumption term. |
Further details |
Note You can not customize the colors of the chart. |