Charts
Last modified:
You can visualize the values currently being measured by your devices under Cockpit > Charts. Measurements are displayed in 1-minute interval values. This feature can be used e.g. for troubleshooting purposes. Here is an overview of the functions:
.png?inst-v=d1056260-aecc-402f-bd40-e8b38a60a0d4)
.png?inst-v=d1056260-aecc-402f-bd40-e8b38a60a0d4)
Charts
Item | Name | Details |
|---|---|---|
1 | Value selection | The active device category is underlined in blue. Example: “Inverters 1/2” means that two inverters are configured and you have selected one to display. Select Select all to select all values for a category. |
2 | Configured devices | Place a checkmark next to the device(s) you want to see in the chart. |
3 | Values | Place a checkmark next to the values you want to view. Multiple selections are possible. Click on Select all to select all values for a category. |
4 | Chart | All devices and values you have selected are displayed as a chart which can display many different parameters. You can zoom in and out of the charts and display a wide range of periods, e.g. from 6 months to 5 minutes. |
5 | Cursor | Move the cursor over the chart to display the values at each point for each device. |
6 | Realtime values | Activate the toggle to display real-time values, if any are available. See Real-time values. |
7 | Download chart | Download a CSV file of your chart |
Note
Cos phi (also known as cos φ or power factor) is a calculated value.
When multiple real meters are combined into a virtual meter, the cos phi value is calculated based on the following formula:
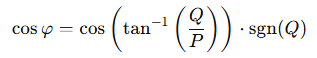
cos phi formula
Variables
P is the measured active power sum of all phases
Q is the measured reactive power sum of all phases
tan-1 represents the arctangent function
sgn(Q) represents the sign of Q, so if Q is underexcited it is -1, otherwise it is 1
Any measured values from the individual meters are ignored.