Simulation and solar power chart
Chart
In the example, the light blue section represents the target range where the solar power ideally should be. The dark blue line shows the actual values for the system, illustrating a deviation.
-20240911-131727.png?inst-v=5b0a41b0-a88b-4bf1-80b4-37c003037a93)
Solar power chart
Basic info
Description | The solar power chart compares simulated solar power production with measured values, allowing you to identify inconsistencies between measured power and the target value. You can also visualize yield losses and irradiance. |
|---|---|
Prerequisites | The simulation is configured under Calculations > Simulation. |
Set up a simulation method for the solar power chart
For the simulation settings, navigate to Calculations > Simulation.
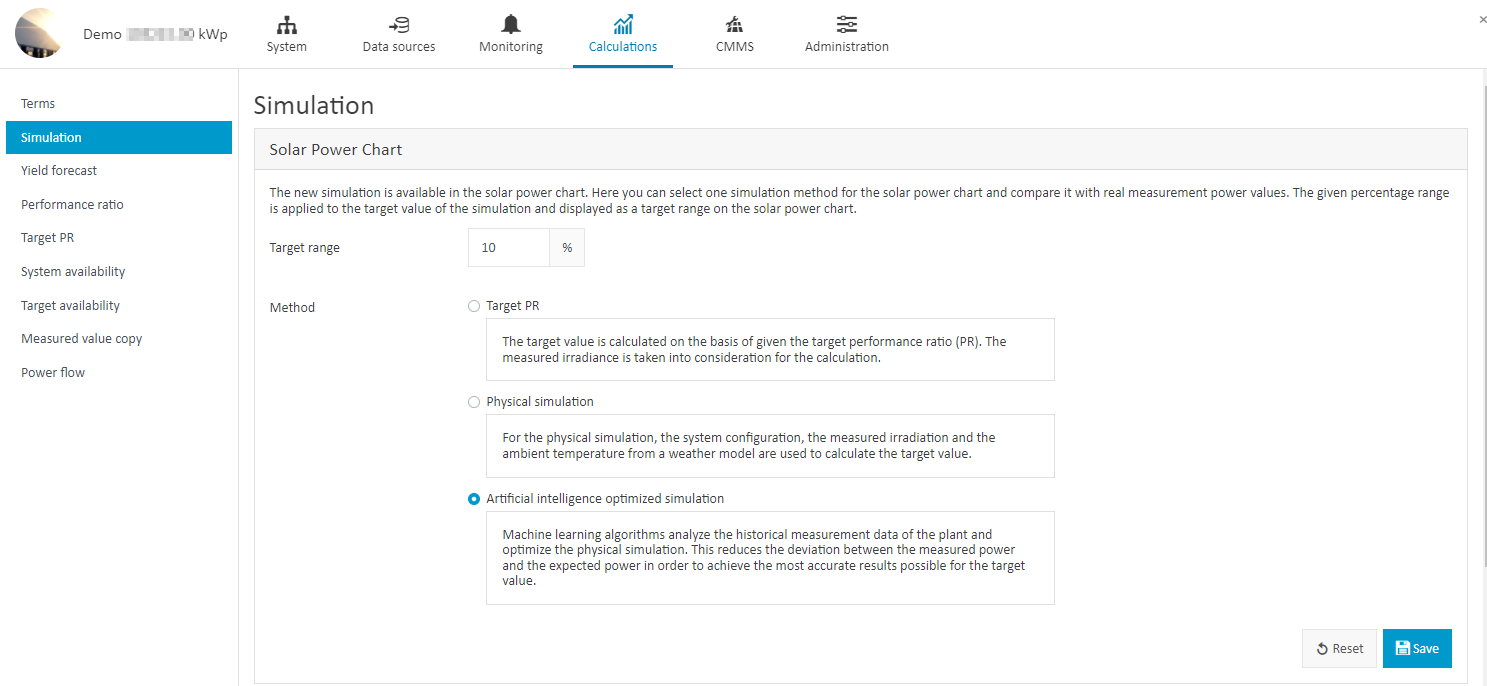
Solar power chart simulation methods
Target range: The percentage (e.g. 10%) is applied to the simulation's target value and represented as a target range on the solar power chart. Data outside of this range is considered a yield loss.
Method: The following methods are used to estimate theoretical production. The method you choose depends on your system setup and preferences:
Method | Description | Prerequisites |
|---|---|---|
Target PR | Default setting. Basic simulation where you can set your expected performance ratio overall or each month as a percentage. |
|
Physical simulation | More exact because it uses more parameters |
|
Machine learning simulation | Machine learning algorithms analyze the historically measured data of the PV system and optimize the physical simulation. |
|
We recommend selecting a simulation method and target range once and only changing it if you want to compare which options display the best results for your system. When making any changes, be sure to select Save. To view the updated solar power chart, navigate to Evaluation > Solar power chart > Refresh icon. If you change the simulation method, you do not need to perform a recalculation.
Recalculate simulation
If you change a term, for example, an irradiance term, you may need to recalculate the simulation for the solar power chart.
Example: If a sensor malfunctions, you switch to another sensor. This requires you to recalculate the simulation to ensure accuracy.
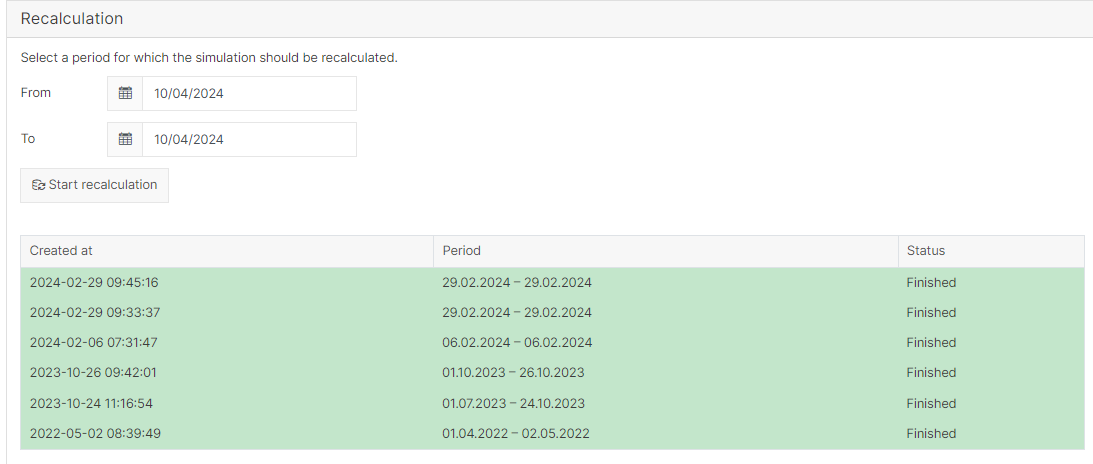
Recalculate simulation values