Financial models and forecasts
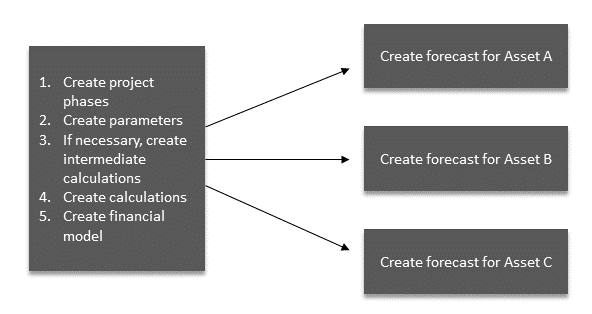
A financial model is a mathematical model that represents a company's operations in the past, present, and forecasted future in numbers. Financial models are used for decision-making and financial analysis. For example, they can be used to estimate the costs and project the profits of a proposed new project, or to model feed-in tariffs, investment subsidies, current power purchase agreements, or market price structures. Based on the calculations and parameters you create, you can create a financial model. You can then use a financial model to create a forecast: see Forecasts. This eliminates the need for multiple spreadsheets for each asset, for example. The basic workflow for financial models and forecasts is as follows:
Step 1: Project phases
To build your financial model, you must specify project phases that represent the phases of a project's financial lifetime. Phases may include planning, construction, and operation, as well as any other phases specific to your company's standards.
Phases and calculations
You can associate a phase with a calculation in your financial model.
When you select a phase for a calculation, the calculation will only consider the period between the start and end dates of the phase.
You can choose the frequency of a calculation, e.g. once, monthly, or annually.
If you carry out a calculation once, it will be executed at the start date of the selected phase, or at the beginning of the project lifetime if no phase is selected.
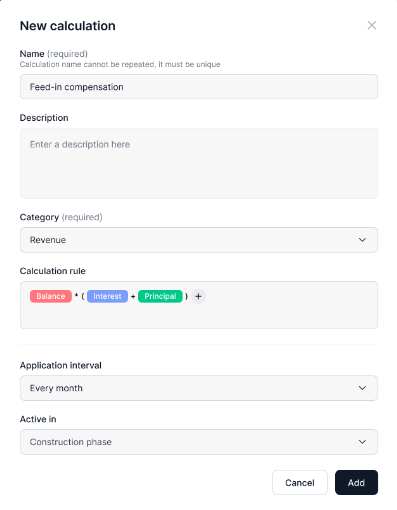
New calculation
Phases and forecasts
Once phases are defined in your financial model, the concrete dates are applied to your forecasts.
When creating your forecast, you must define the start and end month of each phase.
Phases can be active simultaneously, for example if planning and construction overlap. The earliest start and latest end date define the project's lifetime.
If one phase of your project takes longer, you can adjust the dates without the need to adjust your financial model.
Example: If the construction phase needs to be extended, e.g. due to missing parts, documents, certifications, etc., all subsequent phases (operations, decommissioning, etc.) will be automatically moved with the model.
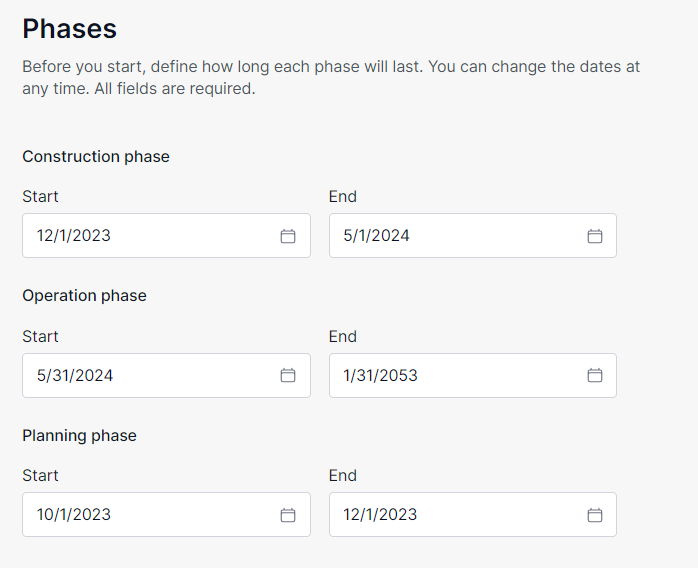
Phases
Step 2: Create parameters
The next step in creating a financial model is to create the parameters you will need. Each parameter you create must have a unique name. The type, unit, and parameter group are also mandatory.
Parameter types
There are several types of parameters:
Parameter type | Description | Visualization | Examples |
|---|---|---|---|
Number | When your forecast is created, the parameter values will be represented by a single value for the asset's entire lifetime |  |
|
Monthly values for one year | When your forecast is created, the parameter values will be represented in months over one year. For changes that take place over a year and which you want to view in months. | 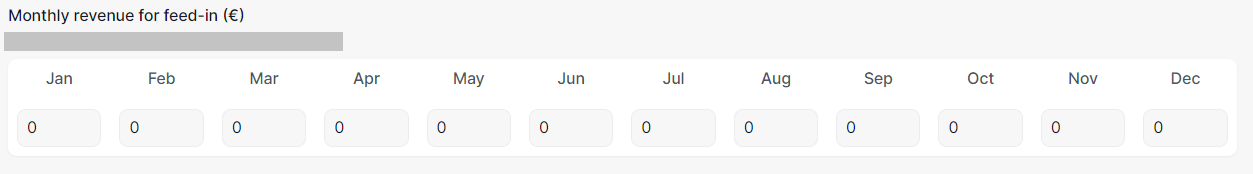 |
|
Monthly values for lifetime | When your forecast is created, the parameter values will be represented in months throughout the entire lifetime (the default value is 30 years). For changes that take place throughout an entire lifetime and which you want to view in months. | 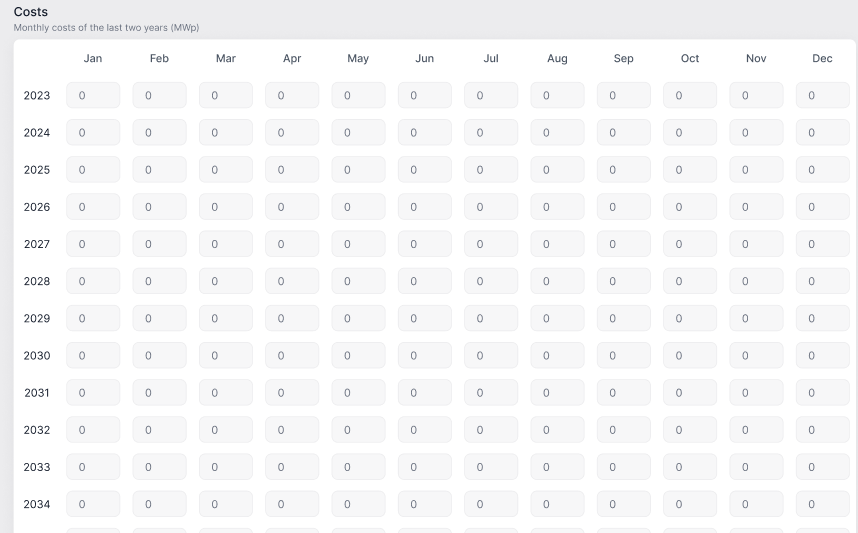 |
|
Annual values for lifetime | When your forecast is created, the parameter values will be represented in years throughout the entire lifetime (the default value is 30 years). For changes that take place throughout an entire lifetime and which you want to view in years. | 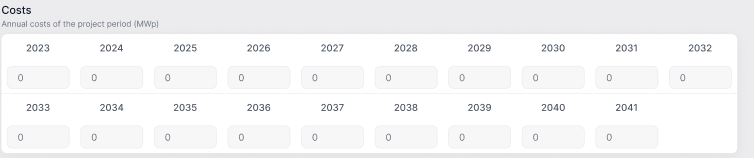 |
|
Parameter units
As a user, you define the units for each parameter. You can enter any unit of your choice. Examples include €, $, kW, MW, kWh, and MWh.
Parameter groups
You must organize parameters into groups that you define according to your needs. Parameter groups themselves are not used for calculations: they help you find and enter parameters into your calculations. Here are some examples of how you can organize your parameters:
Parameter group | Parameter examples |
|---|---|
Grid feed-in |
|
System parameters |
|
Operations and maintenance |
|
Steps 3 and 4: Intermediate calculations and calculations
An intermediate calculation is a formula that may be used as a basis for other calculations, but is not assigned to a cashflow category, and as such is not part of the forecast results on its own. It is an additional step in creating a calculation. Example: System size in MW: m2 * MWh/m2.
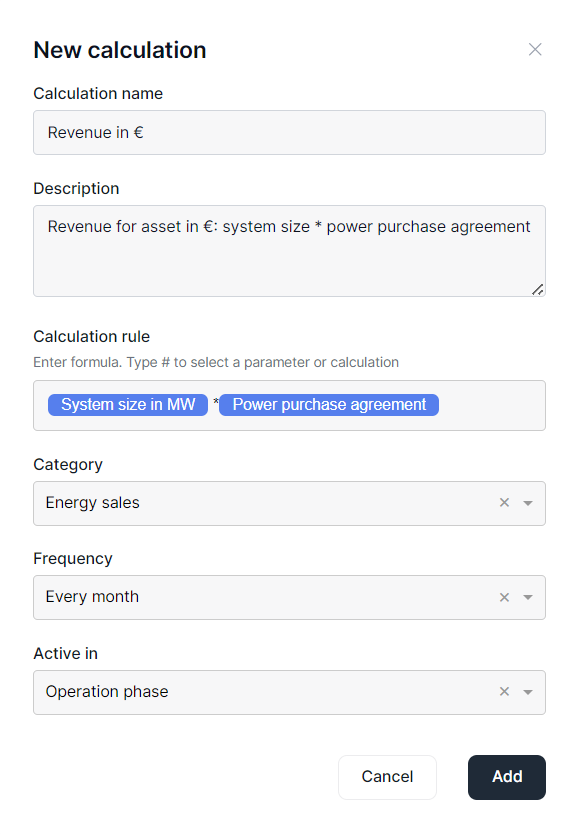
A calculation is the final formula that will be used to create a financial model and forecasts. It is assigned to a cashflow category. Example: Calculation: Revenue in €, Cashflow category: energy sales.
In the entry field, enter the number symbol # to search for parameters or intermediate calculations to apply in your model. The following standard programming operators can be used for calculations:
Plus (+),
Minus(-),
Multiplication (*)
Division (/)
Round parentheses ( ) may also be used.
Step 5: Create a financial model
The steps below describe how to create a financial model. The model is the structure for your calculations. Real data is entered later when you create forecasts: see Forecasts.
The following data is used in the example below:
Phases |
|
Parameters |
|
Intermediate calculations | System size in MW: surface area m2 * yield per square meter MWh/m2 |
Calculations | Revenue in € |
Prerequisites
You have created an organization
Steps
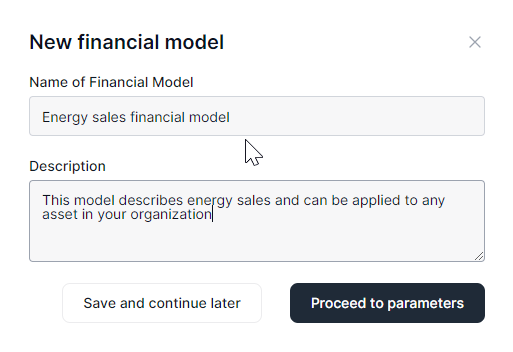
Select the Settings icon > New financial model.
Give the model and name. You can also add a description if desired. Select Proceed to parameters.
In the Phases area, select New phase.
Enter a phase name (e.g. planning, construction, operation, etc.) and description if desired. Select Add.
The phase will be added to your list. Add additional phases as needed.
In the Parameters area, select New parameter.
Enter a parameter name and description (optional), parameter type, parameter group, and unit. Select Add.
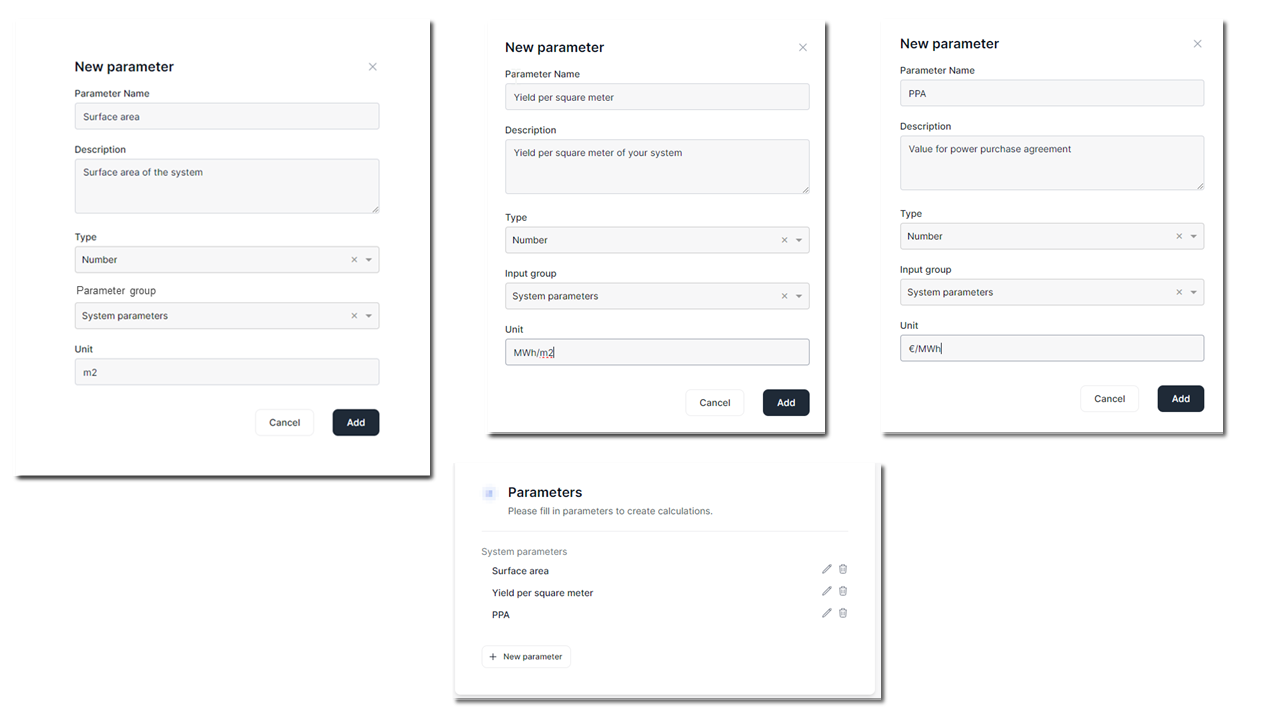
The parameter will be added to your list. Add additional parameters as needed.
If your model requires an intermediate calculation, select New intermediate calculation under Intermediate calculations.
Enter an intermediate calculation name and description, if desired. For the calculation rule, enter a formula. Type the number symbol (#) to display the available parameters. Select Add.
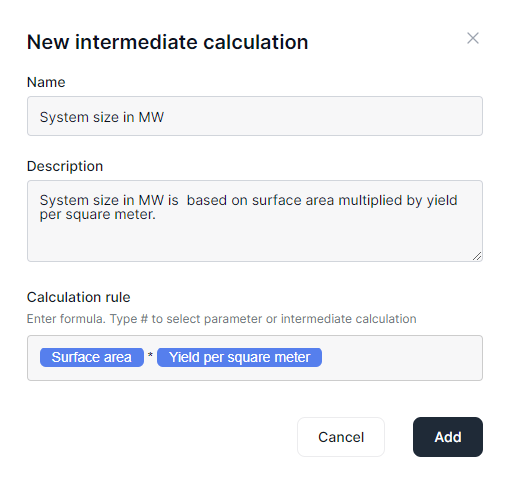
The intermediate calculation will be added to your list. Add additional intermediate calculations as needed.
Under Calculations, select New calculation.
Enter a calculation name and description (optional), category, and interval at which the calculation should be performed. The category dropdown lists the categories to which bank transactions have been mapped, for example energy sales, capital expenses, etc. For the calculation rule, type the number symbol (#) to display the available parameters and intermediate calculations.
Enter the frequency with which the calculation should be performed: once, monthly, or annually. This will depend on the type of calculation you are creating. In the example, we are calculating monthly revenue.
Select the phase in which you want the calculation to be active. In this example, it is active in the operation phase, in other words, when the asset is up and running and generating revenue.
Select Add.
Select Finish to finish your financial model.
You can now create forecasts for your asset using this model. See Forecasts.
If your new financial model does not appear on your dashboard, try reloading the page in your browser or logging out and back in again.
Forecasts
You can create forecasts to track the progress of your entire organization and/or assets. You can apply forecasts to each organization level separately, or apply a forecast to an entire organization. At each level, the desired forecast model must be active.
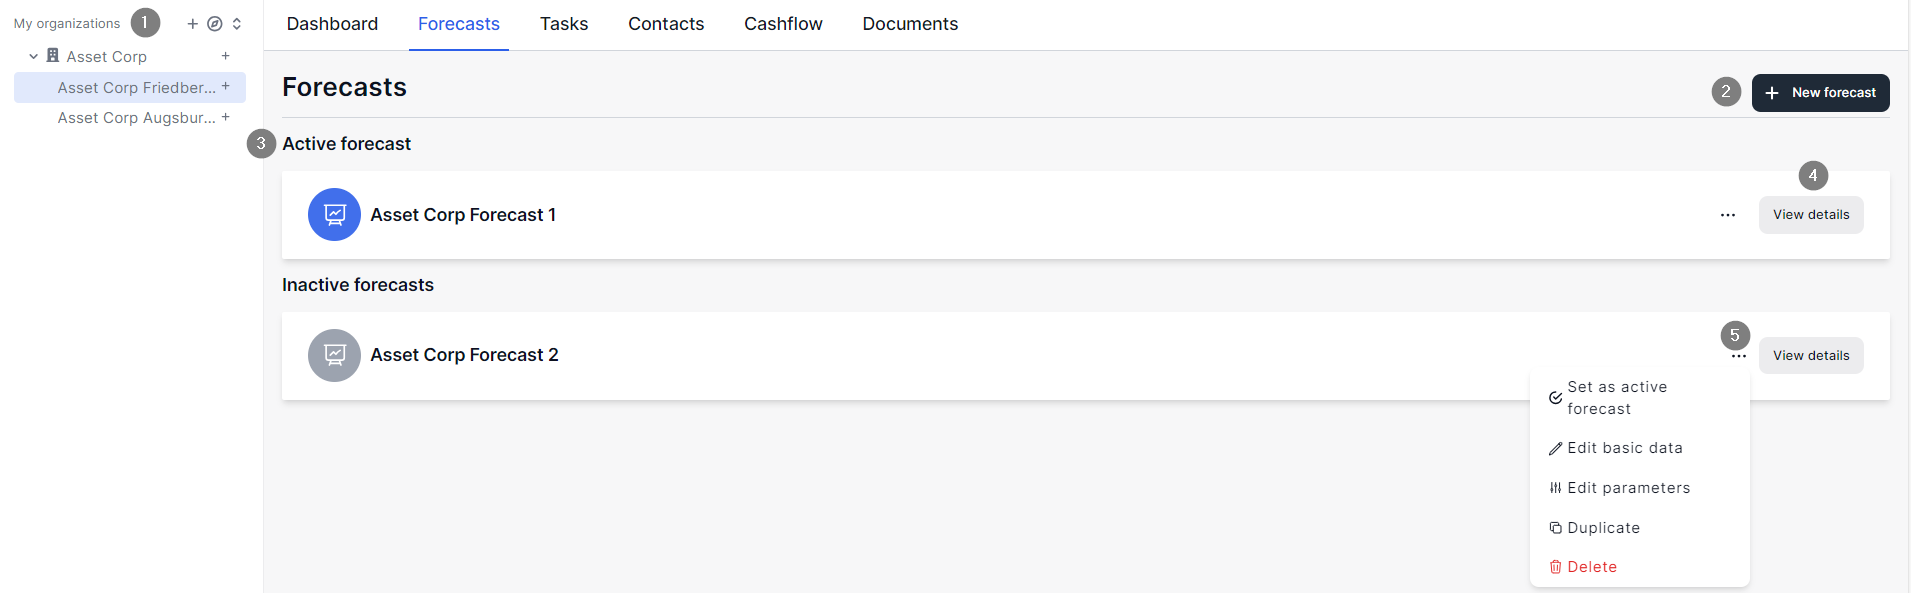
Forecast overview
Item | Name | Details |
|---|---|---|
1 | My organization | Select the organization/asset for which you want to create the forecast |
2 | Add new forecast | Create a new forecast |
3 | Active forecast | The forecast currently displaying your data is the active forecast |
4 | View details | Display the forecast as a graph |
5 | Further actions |
|
Create a forecast
Prerequisites
You have set up at least one organization.
You have created at least one financial model.
Steps
Select an organization level from the side menu and select the Forecasts tab.
If no forecasts exist, select Create forecast. If you are adding a new forecast, select Add forecast.
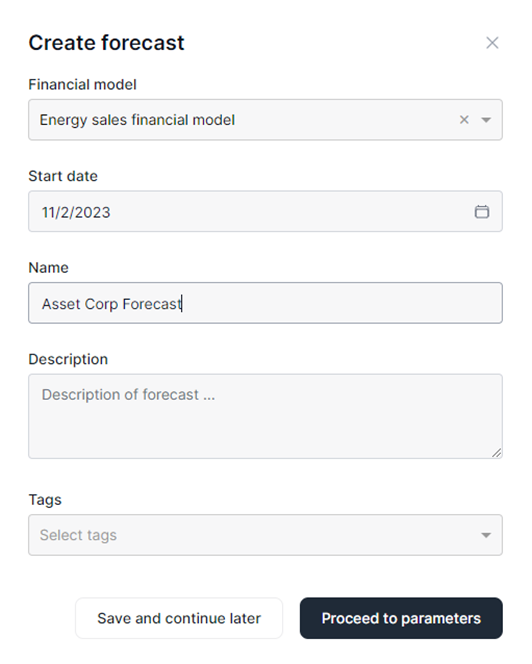
The Create forecast window will appear.
Select a financial model to be used to generate the forecast.
Give the forecast a name and start date, and add a description and tags (optional). Select Proceed to parameters. If you select Save and continue later, you can save the basic forecast data. The forecast will only become active when all the parameters for the selected model template are filled in.
Fill in the dates for the phases.

Fill in the parameter details: Depending on the financial model you select, there will be different parameters to fill in.

Select Finish.
Your new forecast will automatically be set to active, and a graphic will appear on the right-hand side. Select Go to detailed view to expand the forecast information on the full screen.
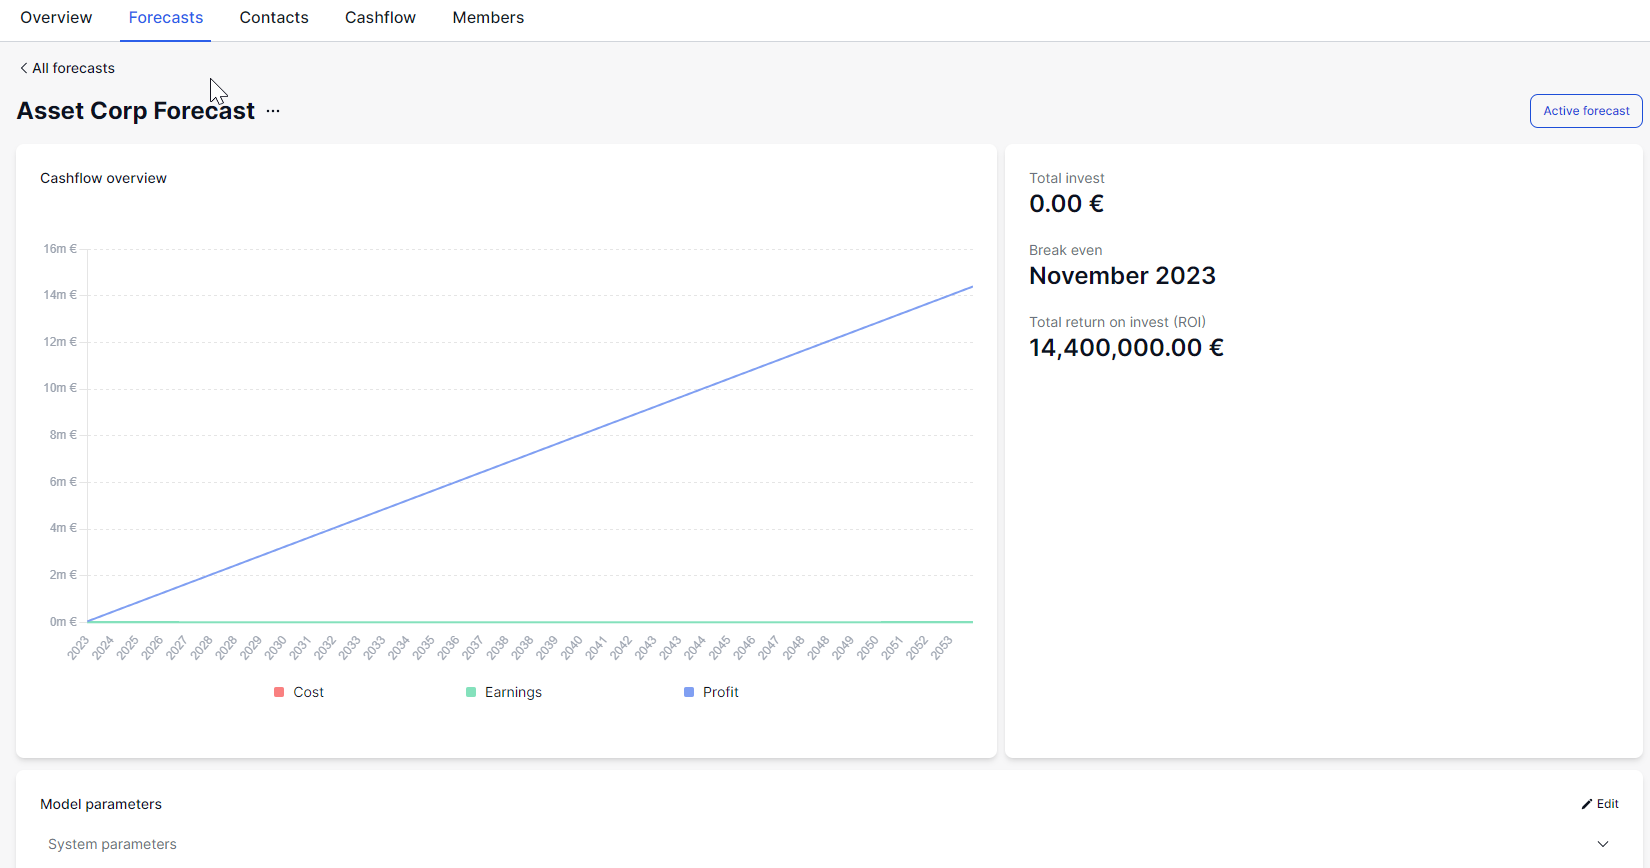
Currently, the forecast will only display periods rather than commas (e.g. 25.0 vs. 25,0).
Further actions
Duplicate a forecast
You can duplicate a forecast, for example, if you want to change one specific parameter, for example different feed-in remuneration or increased maintenance costs.
Steps
Under Forecasts, select the forecast you want to duplicate and go to Extended settings > Duplicate.
The forecast is duplicated in the forecast overview.
In the new forecast, select Extended settings > Edit parameters and edit the necessary parameters.