Dashboards
Dashboards are made up of widgets that give you different overviews of your assets. Depending on your needs, you can have different dashboards for each asset, or apply the same dashboard to all of your assets. For a dashboard view, you must first create a dashboard template. Dashboard templates are located in your organization settings and can be applied to assets of your choice. Changes made to a dashboard template are propagated to all assets using that template.
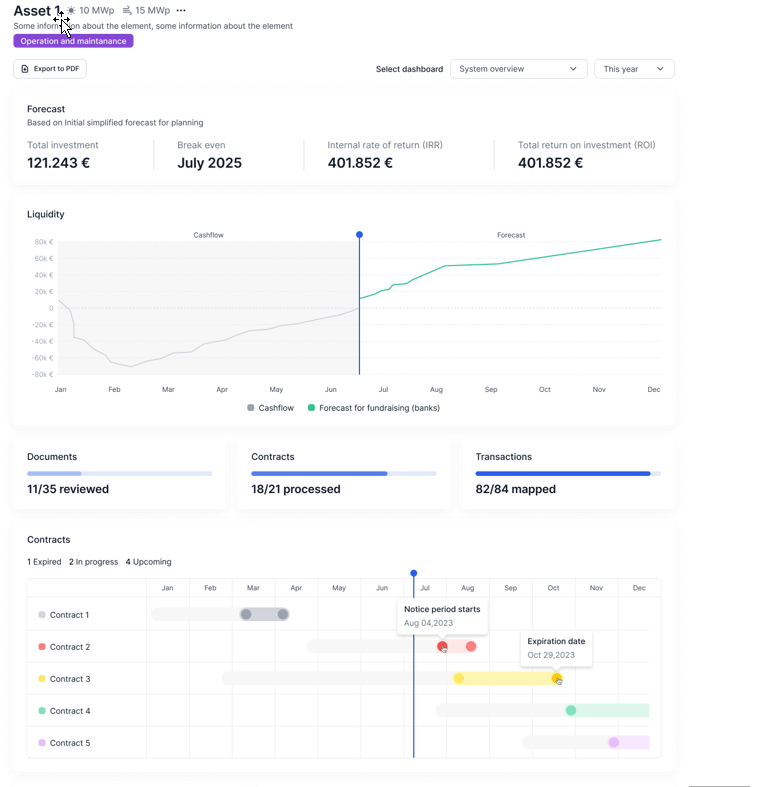
Dashboard template example 1
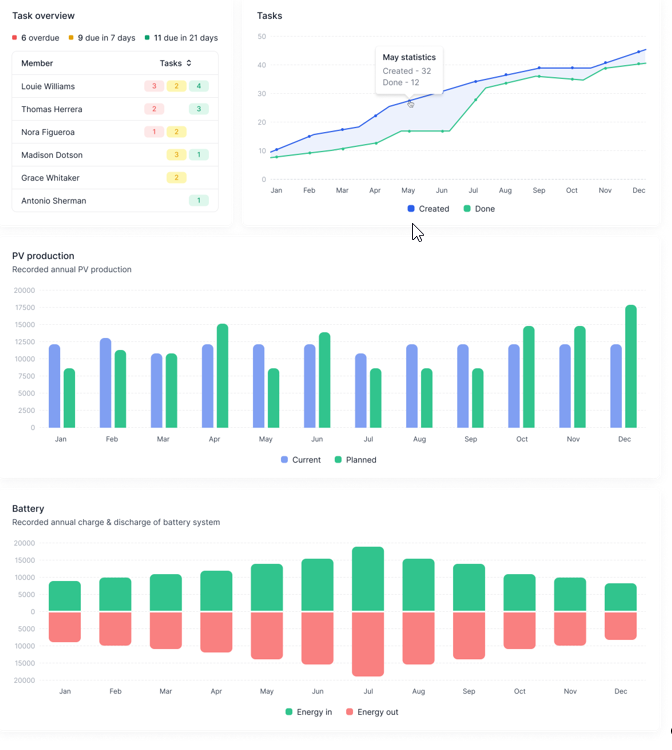
Dashboard template example 2
Create a dashboard template
Dashboard templates are created under your organization's Settings.
Prerequisites
You have created an organization
Steps
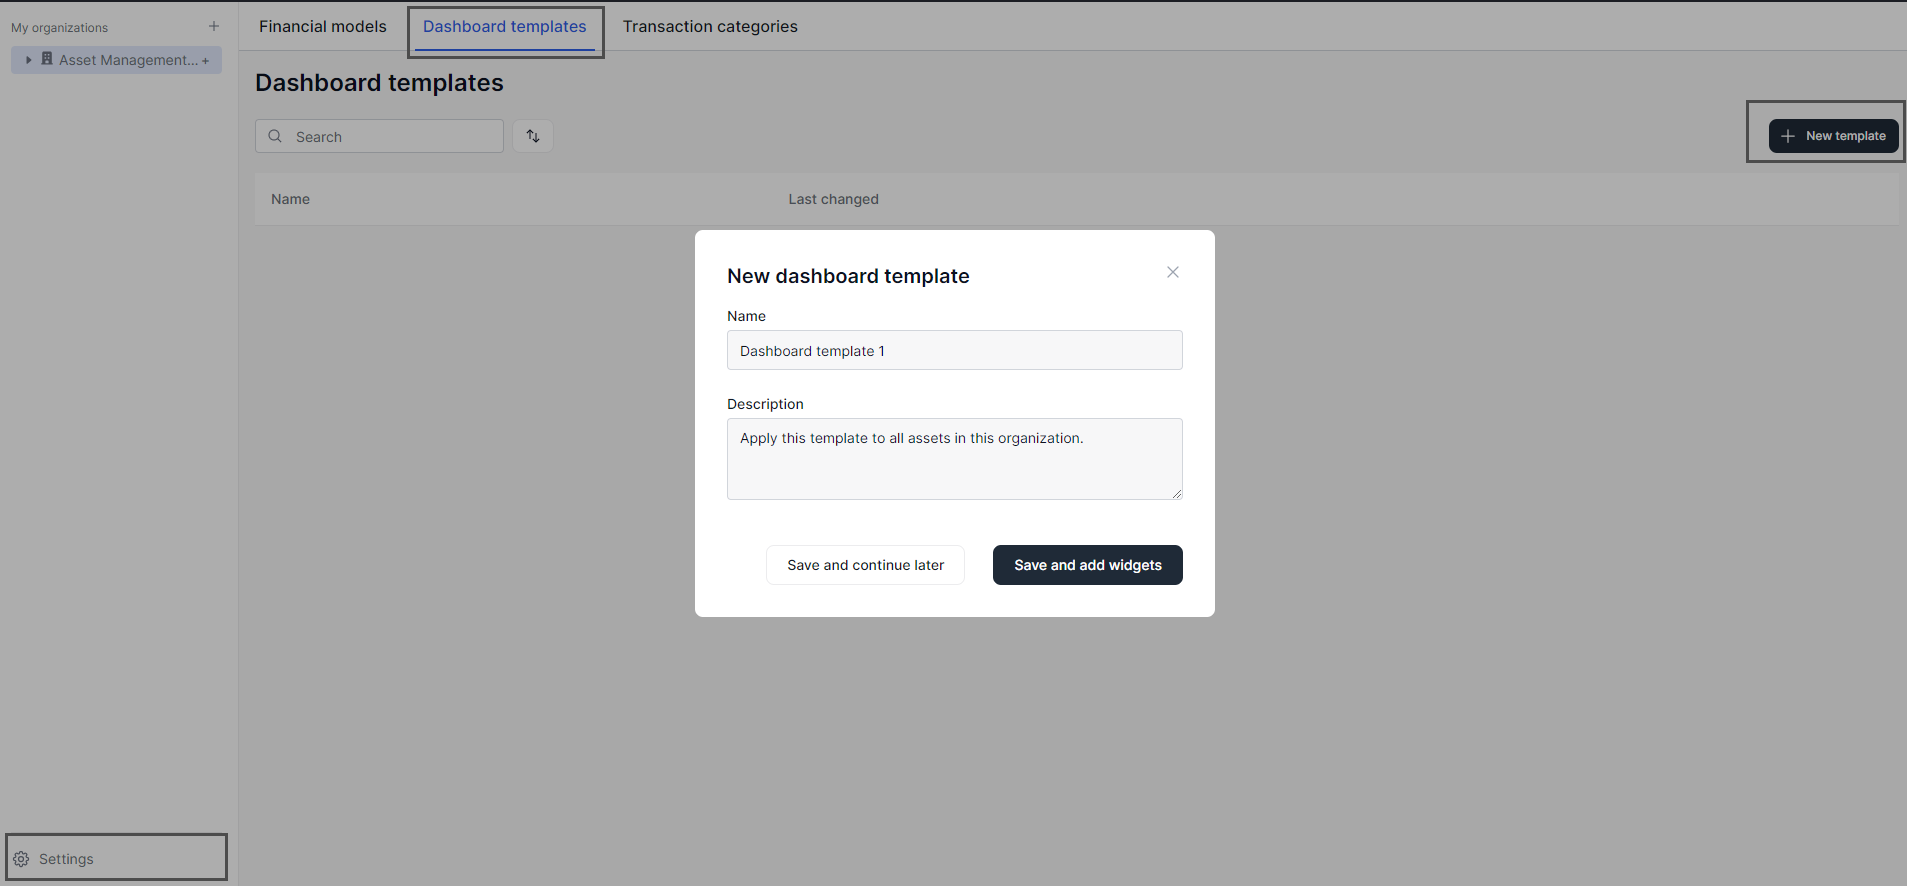
Go to Settings > Dashboard templates > New template.
Give the dashboard template a name and description. Select Save and add widgets.
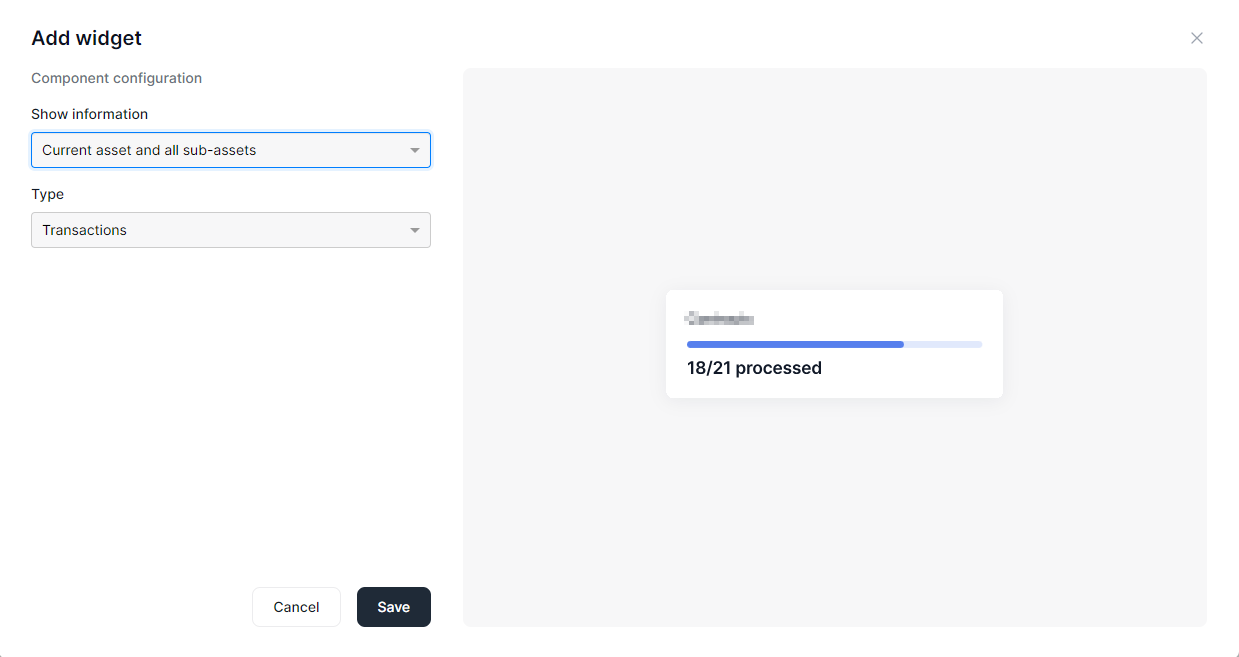
Select Add widget and select the desired widget.
Select the asset(s) to which the widget should apply. Select Save. The example below shows an Unfinished tasks widget which will display the number of bank transactions that still need to be processed for a particular asset and its sub-assets. Depending on the widget you select, additional settings may be required.
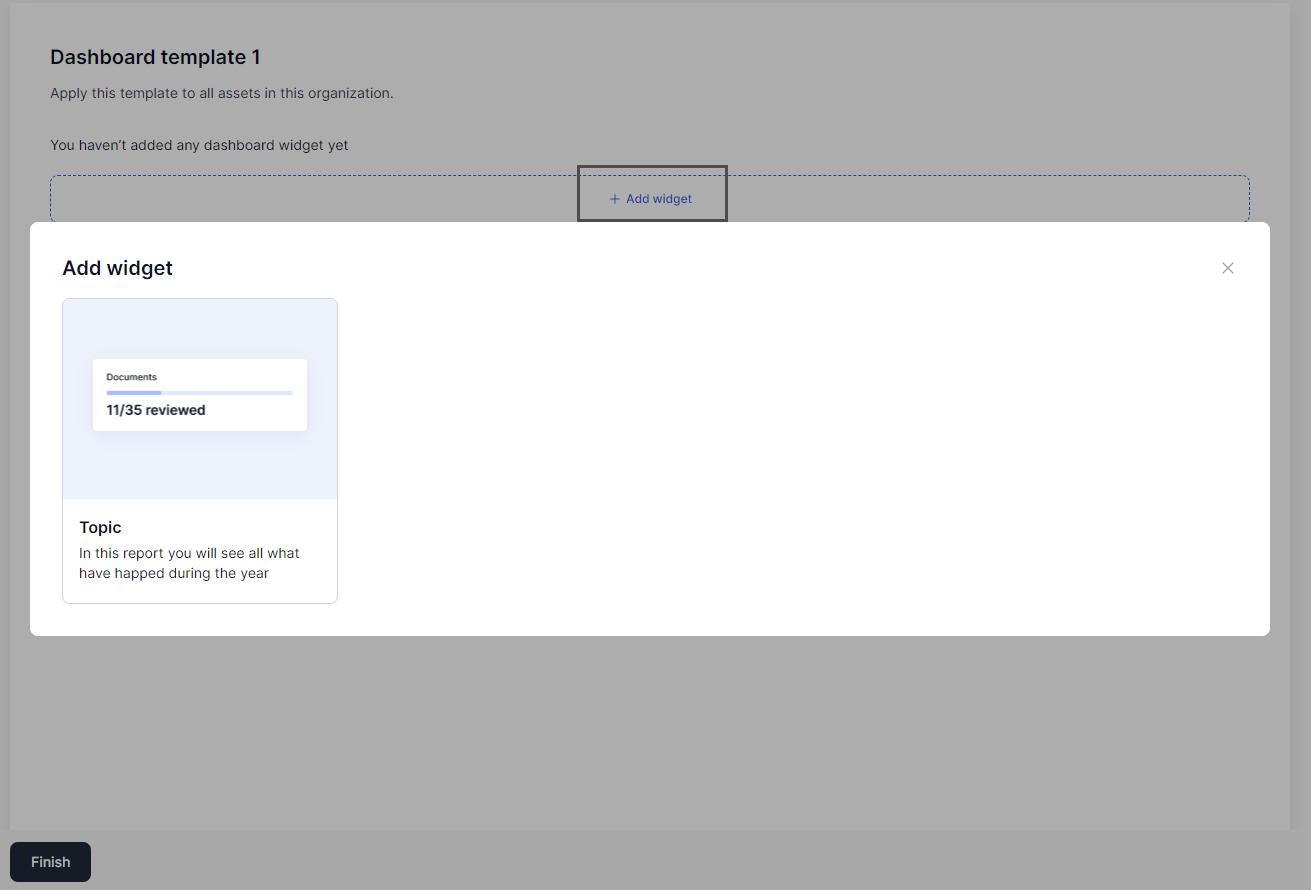
Add additional widgets if desired.
Select Finish. The template will be available in the dashboard templates overview.
Dashboard widgets
The dashboard widgets are briefly described below.
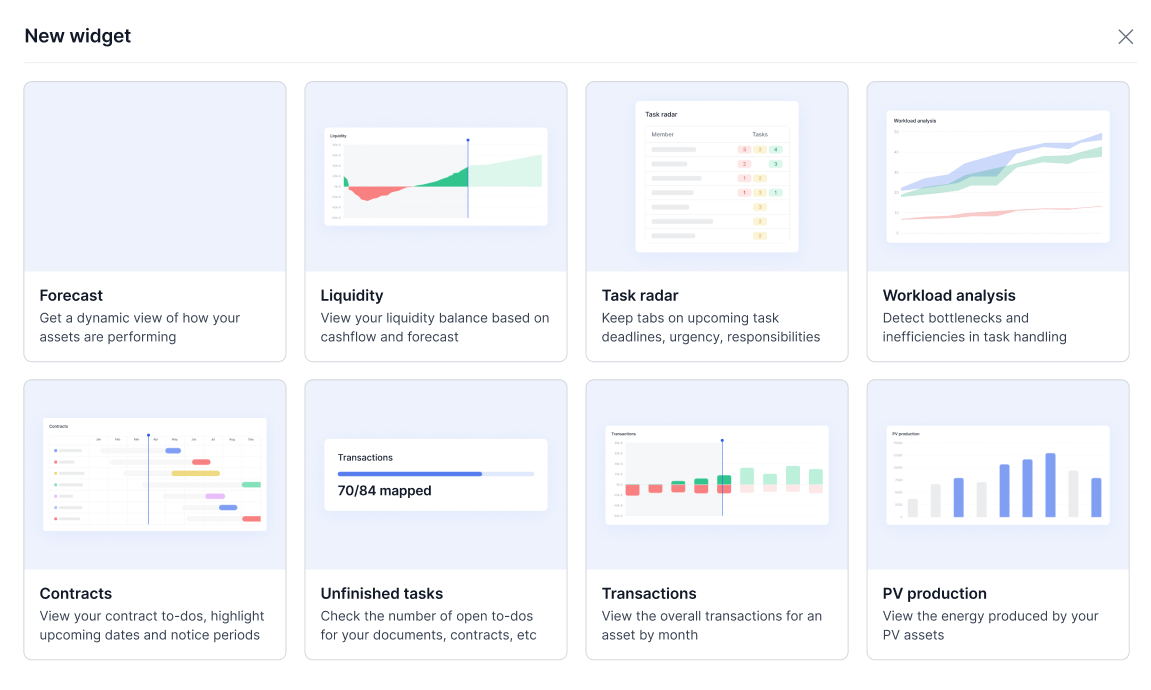
Examples of widgets
Forecast
Get a dynamic view of how your assets are performing.
Liquidity
View your liquidity balance based on your cashflow and forecasts. Cashflow + forecast should ideally be displayed as a continuous line. The gap between these represents the cash that is missing.
Task radar
Keep tabs on upcoming task deadlines, urgency, and responsibilities.
Workload analysis
Identify bottlenecks and inefficiencies in task management. As you continuously complete tasks and add new ones, it's essential to gauge your efficiency. This widget enables you to compare the number of tasks created versus tasks completed, providing insights into your efficiency. The blue line rises as tasks are added, while the green line rises as tasks are solved. A significant gap between the lines suggests a that your workload is too high. You may need to make adjustments to your schedule, such as allocating more time to specific tasks or modifying deadlines.
Contracts
View your contract to-dos and highlight upcoming deadlines such as expiration dates and notice periods. When you are managing numerous assets and their respective contracts, it is essential to keep track of the details so you don't miss any deadlines.
Unfinished tasks
Check the number of open to-dos for your documents, contracts, transactions, tasks, etc.
PV production
View the energy produced by your PV assets. Requires synchronization with VCOM. See VCOM sync.
Battery
View the state of charge and discharge of your batteries.
Liquidity graph (bar)
View the monthly liquidity balance of multiple assets based on cashflow and forecast as a line graph.
Liquidity graph (line)
View the monthly liquidity balance of a single asset using cash flow and forecast data in a bar graph format.
Further actions
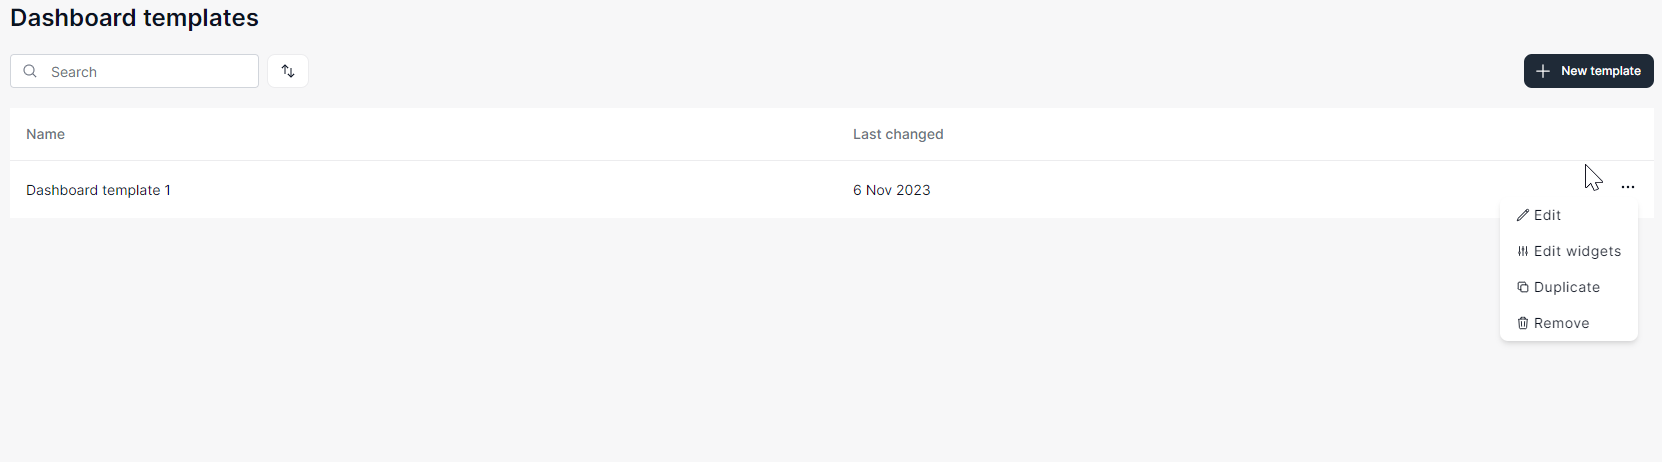
Select the further actions icon (...) to:
Edit template data
Edit widgets in the template
Duplicate a template
Delete a template
Dashboard templates: further actions