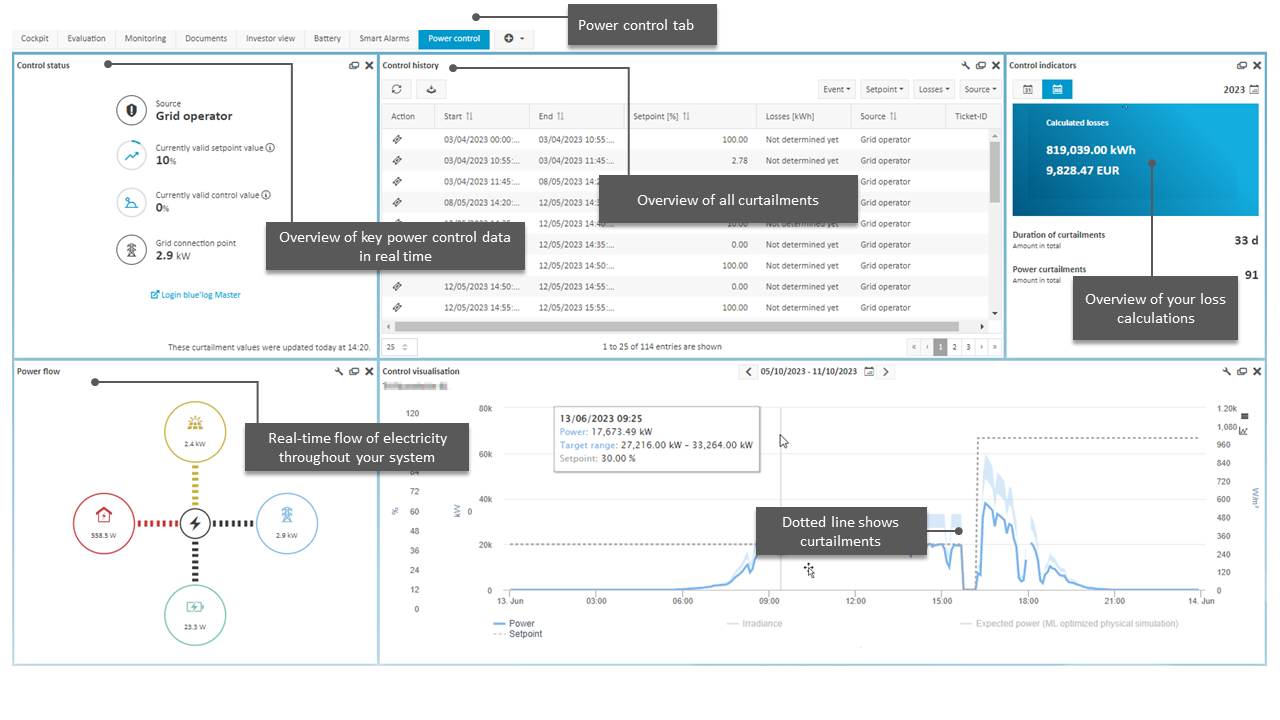
Power control tab
The growth of the renewable energy market has made the integration of renewable energy sources more complex and challenging. System operators and O&M managers are facing more frequent curtailments ("power control events") by grid operators or energy traders to ensure grid stability or to respond to the daily market demands of energy trading. Since curtailments are linked to revenue loss, VCOM users need both real-time and historical overviews of what is happening at the grid connection point of their systems. They also need a quick way to calculate for compensation when the system is curtailed.
The power control tab is a feature for systems that are frequently curtailed, for example by a grid operator, energy trader, or manually by the system owner. The power control tab is available for administrators, operators, and technicians in systems with a power control device (PPC).
Portlets in the power control tab
Power control tab
Control status portlet
The Control status portlet provides an overview of key power control data in real-time
Source of power control: grid operator, energy trader, or system owner
Currently valid setpoint from grid operator, energy trader, or system owner
Currently valid control value: grayed out if the data logger is not a blue'Log
Grid connection point: how much power is entering the grid
If you use a blue’Log as your data logger, you can access the user interface directly from this portlet
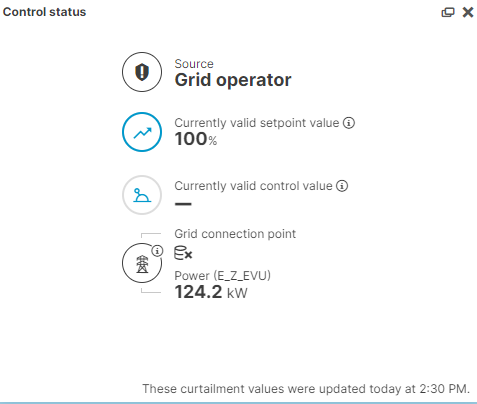
Control status portlet
Control indicators portlet
The control indicators portlet displays information on the duration and total power of curtailments. It provides you with an at-a-glance overview of estimated losses in both kW and currency.
Prerequisites
You have manually carried out yield loss calculations for the system being displayed
Further actions
Filter by the source of control
Download the table as a CSV file
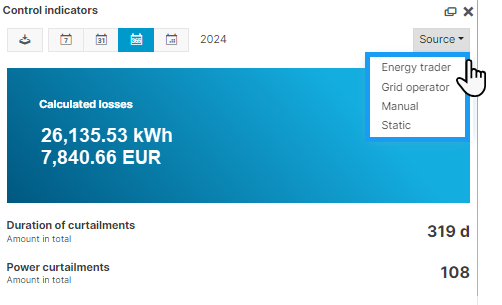
Control indicators portlet
Control history portlet
The Control history portlet provides an overview of all active power curtailments of your system.
Event: period you wish to view
Setpoint: apply a setpoint range
Losses: display yield losses for which calculations must still be generated, or define when a curtailment is considered lost revenue in your system, e.g. starting at 100 kW. See also Yield loss calculation.
 Download icon: CSV export
 Ticket icon: Create tickets or assign existing tickets
 Calculator icon: Calculate yield loss
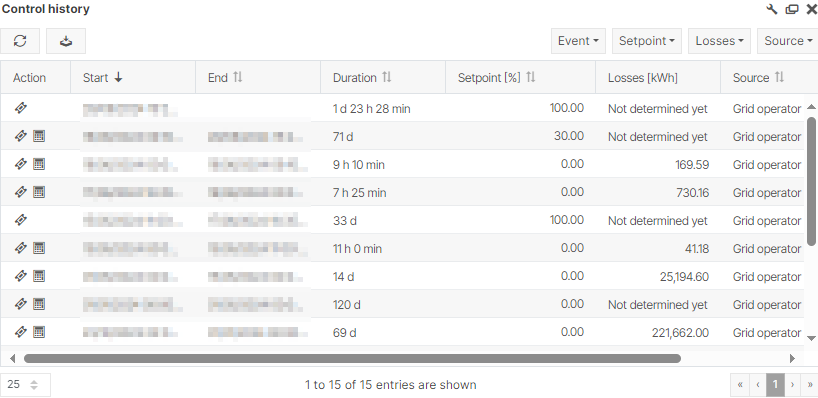
Control history portlet
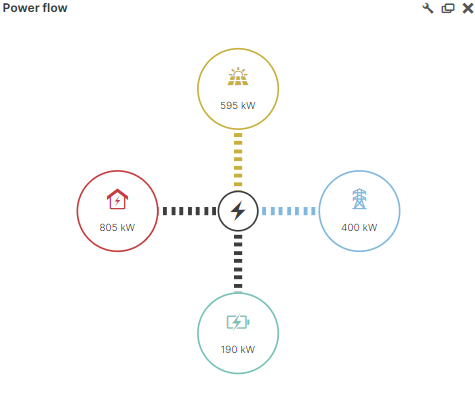
Power flow portlet
Shows the real-time flow of electricity throughout your system
Shows in which directions the electricity flows
The portlet displays a PV system, battery, grid, and/or self-consumption, depending on the components of your system
You can configure each data source under System configuration (wrench icon) > Calculations > Power flow. You must configure a term that defines the exported power as positive.
Power flow portlet
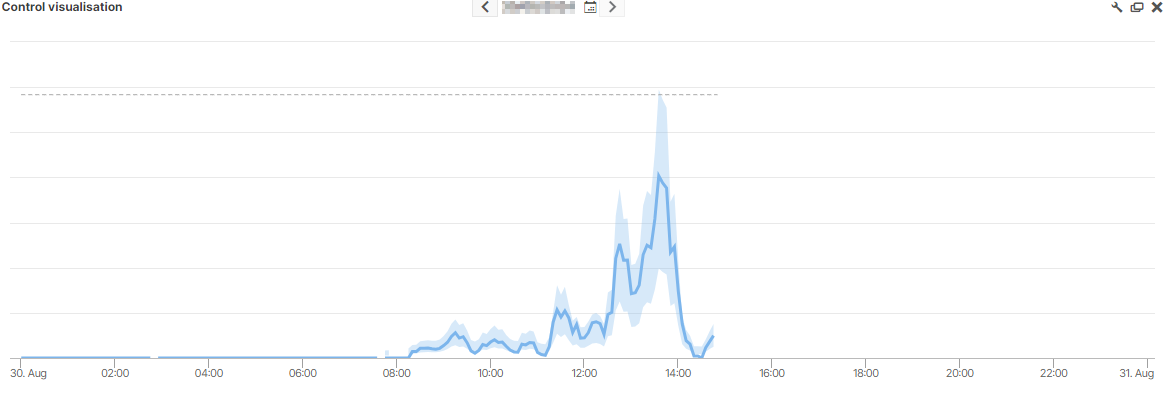
System diagram portlet
The System diagram portlet allows you to display one of your system’s charts as a portlet.
In the example, the Control visualization chart is active. The dotted line shows when power control events (curtailments) take place
System diagram portlet
If the power control tab is not visible, check the following:
Do you have administrator, operator, or technician permissions?
Does a power plant controller (PPC) appear under Data sources > Data device?
The power control portlets described above are available by default under the Power control tab. If you wish to display one of the the portlets in another view at the system level, you can add them via the Portlet center.