CSV exports (reports)
Last modified:
Exports at the PORTFOLIO LEVEL : You can use the CSV export (report) function to export all existing measured and calculated values from one system or your entire portfolio as a CSV file.
Create a CSV export
Prerequisites
Your user group permissions allow you to create CSV exports
Steps
At the PORTFOLIO LEVEL, select
.png?inst-v=7ecd2927-5901-45e0-b389-9cffc4aa6846) Report > CSV export.
Report > CSV export.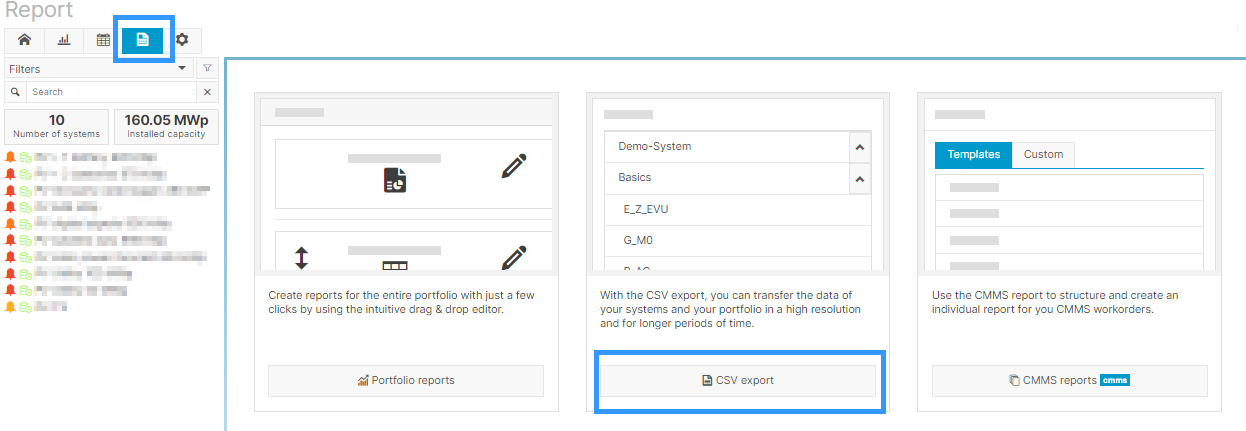
Select CSV export
Select
 Create CSV export.
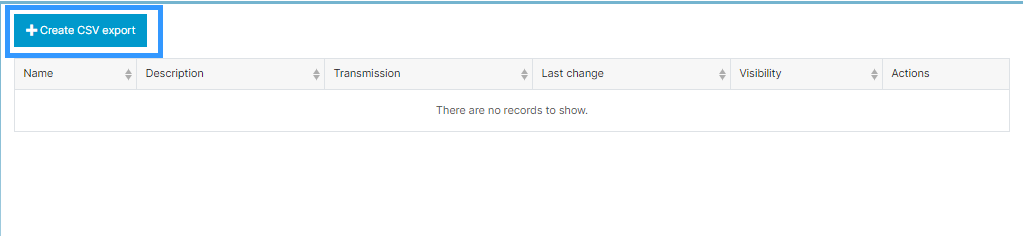
Create CSV export
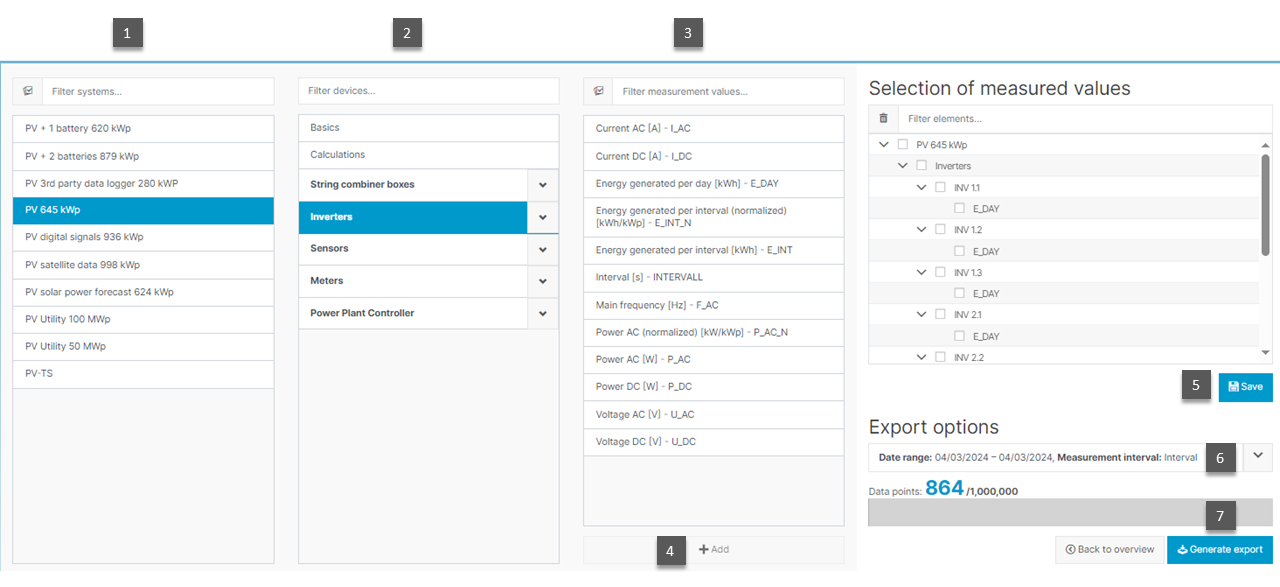
Select your desired metrics:
Systems (1): Choose one or more systems as the source. If you select multiple systems, only a limited list of “matching” devices and measured values will be available.
Devices (2): All available devices are grouped by type. You can select individual devices or entire groups.
Measured values (3): To add a measured value, select a measured value from the list and click on
Add (4). Alternatively, you can double-click on a measured value to select it. Only measured values that are available for all devices are shown.Optionally, you can
 Save (5) the CSV report with its current configurations.
Optionally, you can specify the Measurement interval (6). The measurement interval depends on the data logger used. A maximum of 1 million measured values can be exported per CSV export.
Select metrics
Select
 Generate Export (7). You can now edit or view the data in a CSV-capable spreadsheet program.
Send reports via VCOM
You can send reports directly via VCOM without the need to download and email them using a separate tool.
Steps
Select the
 Envelope next to the report you wish to send.
Fill out the following fields:
Recipient: Must be in the Contacts list. Multiple recipients must be separated by a comma.
Transmission interval: How often you want to send the report
Measurement interval: The options will vary depending on your data logger settings
Select
Save. The report will be generated and sent for the upcoming interval.
Further actions
 Pencil: Edit an existing CSV export template